Mapping donor contributions in the Pacific
Associate Professor Toeolesulusulu Damon Salesa, Director, New Zealand Institute for Pacific Research. 3D visualisation by Nick Young, Research IT Specialist, Centre for eResearch, University of Auckland.
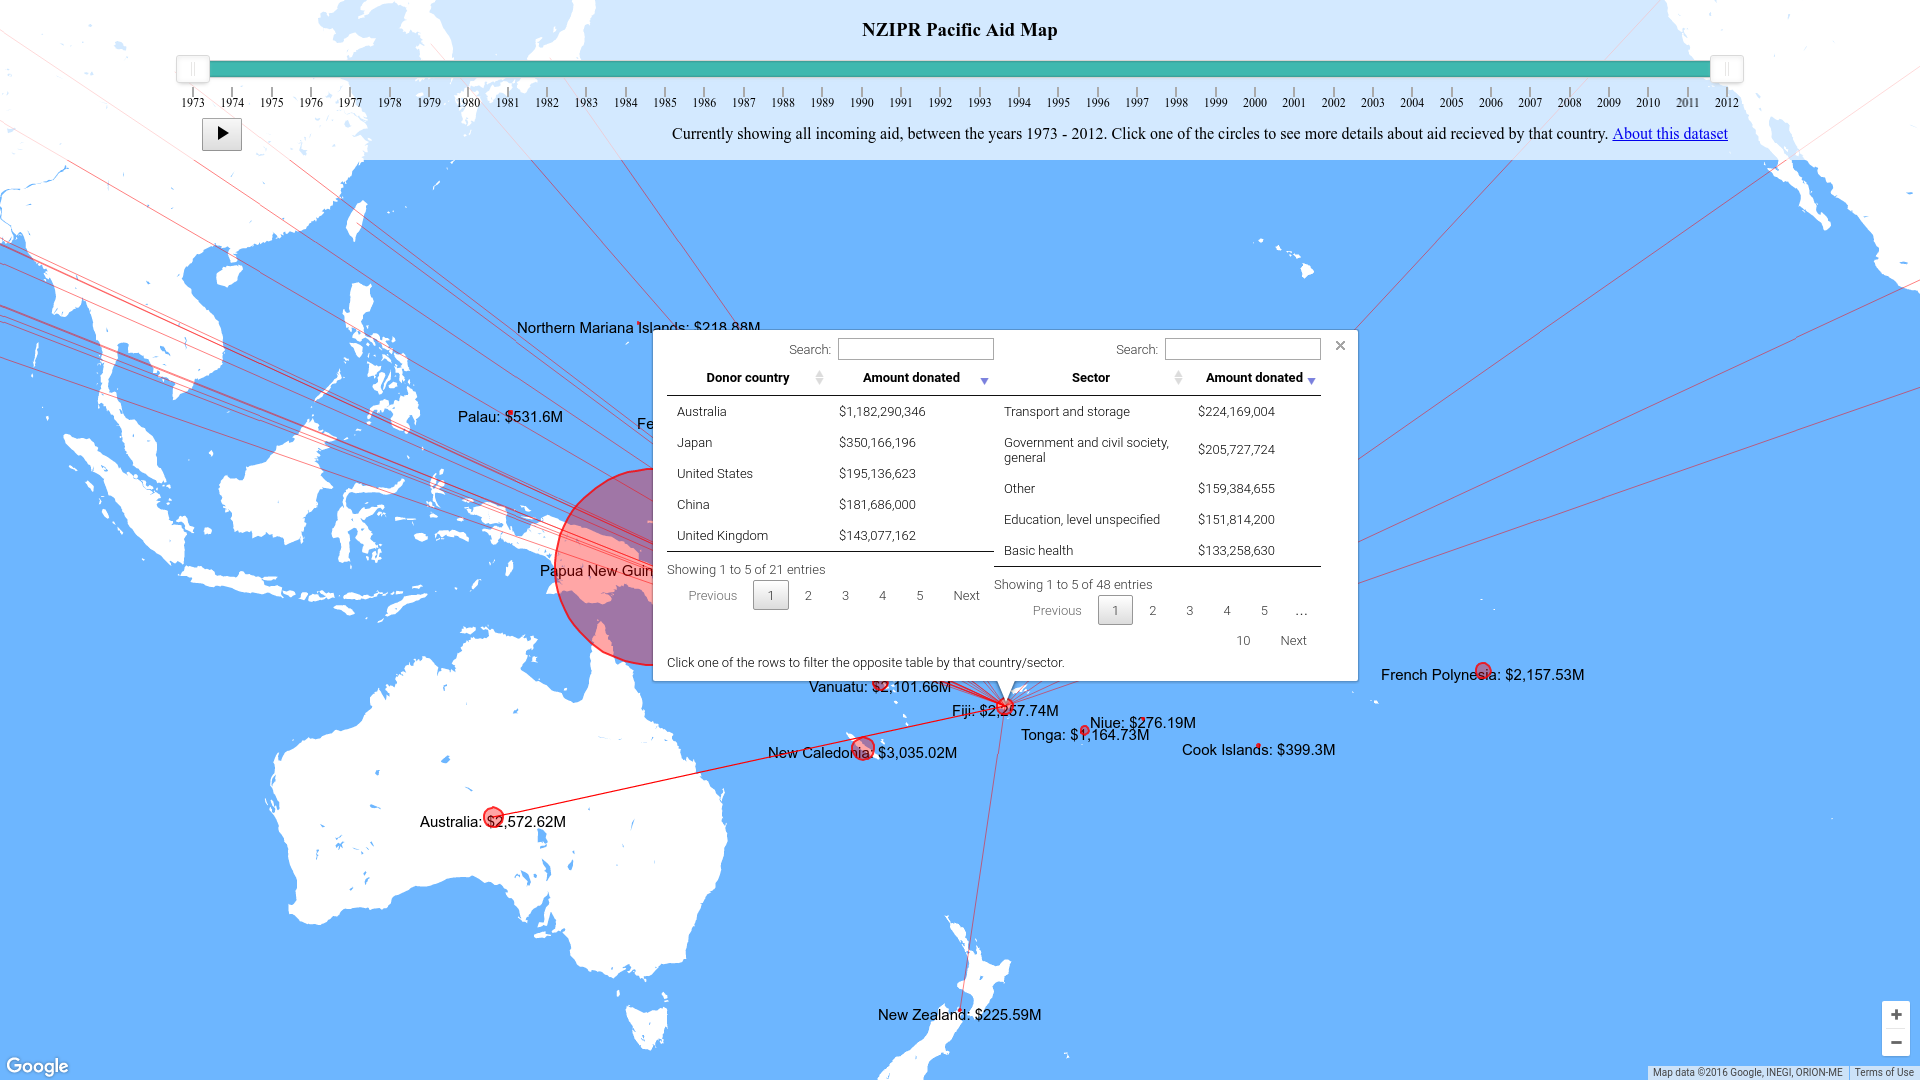
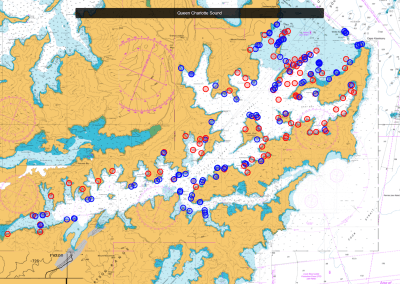
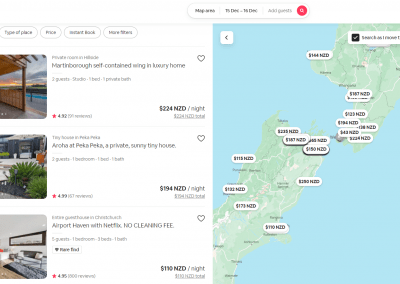
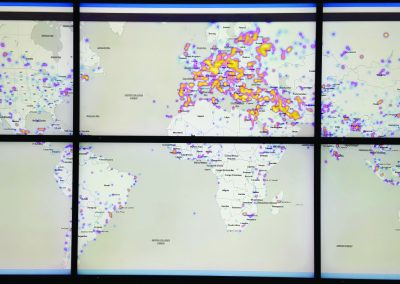
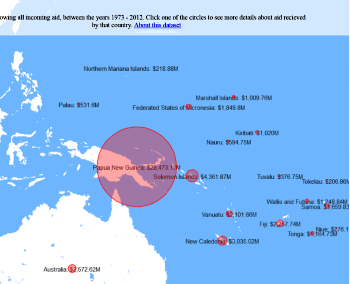
Figure 1. A screen shot of the interactive web application for donor mapping.
Overview
The New Zealand Institute for Pacific Research (NZIPR) is building a dynamic model of donor contributions in the Pacific region. The model will be constructed using data from a number of sources and the results will be displayed on a visualisation tool created by staff at the Centre for eResearch (CeR). The visualisation tool will be accessible from the NZIPR website. The purpose of the visualisation tool, funded by the Ministry of Foreign Affairs and Trade (MFAT), is to provide policy makers, interested members of the public and researchers with a way to: The New Zealand Institute for Pacific Research (NZIPR) is building a dynamic model of donor contributions in the Pacific region. The model will be constructed using data from a number of sources and the results will be displayed on a visualisation tool created by staff at the Centre for eResearch (CeR). The visualisation tool will be accessible from the NZIPR website. The purpose of the visualisation tool, funded by the Ministry of Foreign Affairs and Trade (MFAT), is to provide policy makers, interested members of the public and researchers with a way to:
- visualise the donor aid flows into the Pacific region
- conduct analysis of these aid flows.
Data will be obtained from a broad range of sources including the OECD’s creditor reporting website and other relevant sources of information.
The prototype – developed as proof of concept – has used data from the AidData website (aiddata.org) which is an open data source of international development information. Over time other key economic data such as GDP, GNP, inflation and trade flow information will be added along with important socio-demographic indicators such as life expectancy, population structure, education level, etc. A prototype was presented in August 2016 and signed off by MFAT. The first stage of the project will be completed by December 2017.
How the Centre for eResearch helps with the visualisation and analytics
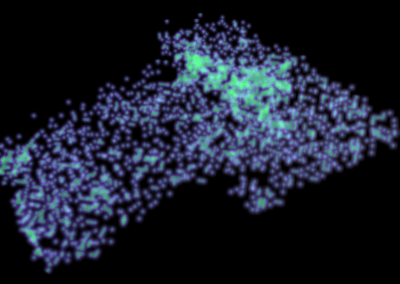
Staff at the Centre for eResearch are building a visual spatial map which includes a 3D version for aid into the Pacific region, and will then help to display these maps interactively on the NZIPR’s website (see Figure 1, an example of screen shot zoom in Solomon Island) with the objective to maximise utility and user-friendliness. The maps are augmented by tables and charts showing the underlying information which can be manipulated or filtered by the user. The database behind the tool needs to be able to be updated with new information as it becomes available. Staff at the Centre for eResearch used a database conversion tool called sqlizer (https://sqlizer.io/) to generate a SQL table definition from the http://aiddata.org/country-level-research-datasets#aiddata-research-release-30 dataset and loaded it into a mysql database.

What’s Next?
The visualisation tool will be developed in several stages. This will enable enhancements to be made to the tool as additional sources of information are obtained, as further means of analysing data are developed and as ways of displaying the data are produced. In addition, a mechanism by which the data behind the visualisation can be easily updated will be developed. At each stage, technical development will be responsive to the requirements of MFAT and the wider development community.
See more case study projects

Our Voices: using innovative techniques to collect, analyse and amplify the lived experiences of young people in Aotearoa
Painting the brain: multiplexed tissue labelling of human brain tissue to facilitate discoveries in neuroanatomy

Detecting anomalous matches in professional sports: a novel approach using advanced anomaly detection techniques

Benefits of linking routine medical records to the GUiNZ longitudinal birth cohort: Childhood injury predictors
Using a virtual machine-based machine learning algorithm to obtain comprehensive behavioural information in an in vivo Alzheimer’s disease model
Mapping livability: the “15-minute city” concept for car-dependent districts in Auckland, New Zealand
Travelling Heads – Measuring Reproducibility and Repeatability of Magnetic Resonance Imaging in Dementia
Novel Subject-Specific Method of Visualising Group Differences from Multiple DTI Metrics without Averaging

Re-assess urban spaces under COVID-19 impact: sensing Auckland social ‘hotspots’ with mobile location data
Aotearoa New Zealand’s changing coastline – Resilience to Nature’s Challenges (National Science Challenge)
Proteins under a computational microscope: designing in-silico strategies to understand and develop molecular functionalities in Life Sciences and Engineering
Coastal image classification and nalysis based on convolutional neural betworks and pattern recognition
Determinants of translation efficiency in the evolutionarily-divergent protist Trichomonas vaginalis
Measuring impact of entrepreneurship activities on students’ mindset, capabilities and entrepreneurial intentions

Using Zebra Finch data and deep learning classification to identify individual bird calls from audio recordings
Automated measurement of intracranial cerebrospinal fluid volume and outcome after endovascular thrombectomy for ischemic stroke
Using simple models to explore complex dynamics: A case study of macomona liliana (wedge-shell) and nutrient variations
Fully coupled thermo-hydro-mechanical modelling of permeability enhancement by the finite element method
Modelling dual reflux pressure swing adsorption (DR-PSA) units for gas separation in natural gas processing
Molecular phylogenetics uses genetic data to reconstruct the evolutionary history of individuals, populations or species

Wandering around the molecular landscape: embracing virtual reality as a research showcasing outreach and teaching tool


