Aotearoa New Zealand’s changing coastline – Resilience to Nature’s Challenges (National Science Challenge)
Assoc Prof Mark Dickson, Dr Murray Ford and Dr Emma Ryan, Senior Lecturers, Dr Megan Tuck, Research Fellow, School of Environment
Background of the research
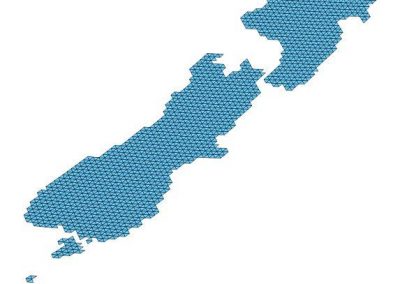
Understanding long-term shoreline change patterns is crucial for effective management of coastlines. Decadal-scale records of shoreline change are typically determined by mapping shorelines using series of historical aerial imagery. In New Zealand, such shoreline change records are limited and highly fragmented, being derived from techniques that are inconsistent in different regions around the country. The Coastal team within the Resilience to Nature’s Challenges National Science Challenge are undertaking an ambitious project to map national-scale shoreline change in New Zealand over the past century. Applying cutting-edge remote sensing and geospatial tools, shoreline mapping of historical aerial photographs as well as more recent high-resolution satellite imagery will be conducted to provide national-scale coverage of shoreline positions since the early 1900s. This research will transform our understanding of past and present coastal change and provide the scientific datasets necessary for future-casting physical coastal change.
Approach
To date, we have georeferenced and digitised ~3000 km of historical shoreline imagery for all unconsolidated shorelines in the Northland region since the late 1930s. In addition, higher frequency shoreline analyses were undertaken for 20 ‘super-sites’ of interest to coastal managers using high-resolution commercial imagery obtained from the Maxar constellation of satellites. Shoreline data were analysed using the Digital Shoreline Analysis System (DSAS), which revealed net shoreline change (erosion and accretion) rates, among other shoreline change statistics and spatial and temporal patterns. In Northland our analyses have identified coastal erosion hotspots and broad-scale differences in shoreline change patterns between the west and east coasts, including areas of significant erosion and accretion as well as sections of coast that have been remarkably stable despite interdecadal climatic fluctuations and observed sea level rise over the past century.

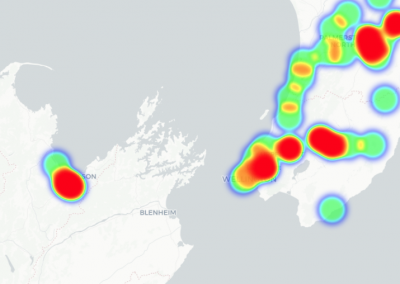
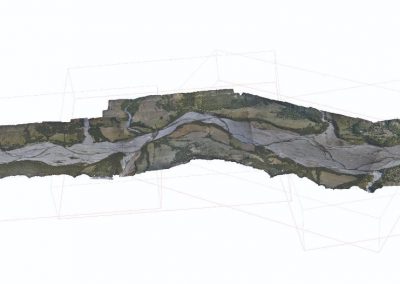
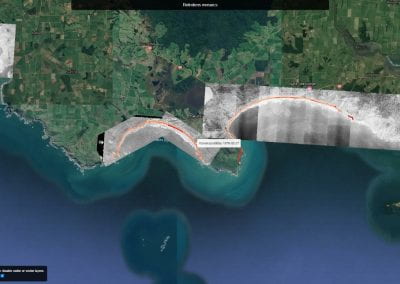
Figure 1: Rate of shoreline change (accretion and erosion) at Tiwai Point since 1951.
We have developed a robust and efficient methodology that is ready to be rolled out nationwide. As an example of our workflow and the data product it produces, we describe below a recent example of shoreline change mapping at Tiwai Point in Southland. The Aluminium smelter at this site has a store of highly toxic substances located only 85 m from the beach and concerns have been raised as bores used to monitor groundwater pollution have been lost to coastal erosion.
Results: An example of shoreline change mapping at Tiwai Point in Southland
Shorelines derived from historical aerial photographs and commercial satellite imagery show that the shoreline at Tiwai Point is highly dynamic, with the majority of the shoreline exhibiting substantial accretion (up to 1 m/yr) since 1951 (Figure 1). A transect from the front of the aluminium smelter landfill shows that the shoreline predominantly exhibited accretion for the past 60 years (Figure 2). However, analysis of the more recent and higher resolution satellite imagery indicates that for the past 10 years the shoreline has been heavily eroded and has recently eroded beyond the 1951 shoreline position (Figure 2). Results of the shoreline analysis highlight the importance of analysing the high-resolution satellite imagery that reveals the erosive trend of the shoreline over the past 10 years (Figure 2).
Data visualization
An important aspect of our work was to increase the visibility of the shoreline change data and make it publicly available. Nick Young from the Centre for eResearch set up a NeCTAR VM to host a tile server for the ~4GB of historical imagery mosaic rasters, using the open-source tools MapServer and MapProxy. He then developed a web-based interface to browse this data, along with the traced shoreline vector data, using the open-source JavaScript library Leaflet. All code is open-source, and can be found at https://github.com/UoA-eResearch/retrolens. The resulting web application can be found at https://uoa-eresearch.github.io/retrolens/mosaics

Figure 2: Shoreline distance graph from single transect in front of landfill at Tiwai Point.
See more case study projects

Our Voices: using innovative techniques to collect, analyse and amplify the lived experiences of young people in Aotearoa
Painting the brain: multiplexed tissue labelling of human brain tissue to facilitate discoveries in neuroanatomy

Detecting anomalous matches in professional sports: a novel approach using advanced anomaly detection techniques

Benefits of linking routine medical records to the GUiNZ longitudinal birth cohort: Childhood injury predictors
Using a virtual machine-based machine learning algorithm to obtain comprehensive behavioural information in an in vivo Alzheimer’s disease model
Mapping livability: the “15-minute city” concept for car-dependent districts in Auckland, New Zealand
Travelling Heads – Measuring Reproducibility and Repeatability of Magnetic Resonance Imaging in Dementia
Novel Subject-Specific Method of Visualising Group Differences from Multiple DTI Metrics without Averaging

Re-assess urban spaces under COVID-19 impact: sensing Auckland social ‘hotspots’ with mobile location data
Aotearoa New Zealand’s changing coastline – Resilience to Nature’s Challenges (National Science Challenge)
Proteins under a computational microscope: designing in-silico strategies to understand and develop molecular functionalities in Life Sciences and Engineering
Coastal image classification and nalysis based on convolutional neural betworks and pattern recognition
Determinants of translation efficiency in the evolutionarily-divergent protist Trichomonas vaginalis
Measuring impact of entrepreneurship activities on students’ mindset, capabilities and entrepreneurial intentions

Using Zebra Finch data and deep learning classification to identify individual bird calls from audio recordings
Automated measurement of intracranial cerebrospinal fluid volume and outcome after endovascular thrombectomy for ischemic stroke
Using simple models to explore complex dynamics: A case study of macomona liliana (wedge-shell) and nutrient variations
Fully coupled thermo-hydro-mechanical modelling of permeability enhancement by the finite element method
Modelling dual reflux pressure swing adsorption (DR-PSA) units for gas separation in natural gas processing
Molecular phylogenetics uses genetic data to reconstruct the evolutionary history of individuals, populations or species
Wandering around the molecular landscape: embracing virtual reality as a research showcasing outreach and teaching tool


