Re-assess urban spaces under COVID-19 impact: sensing Auckland social ‘hotspots’ with mobile location data
-Ting Chuang – Lecture, School of Architecture and Planning, University of Auckland ; Qingqing Chen -PhD Candidate, Department of Geography, College of Arts and Sciences, University at Buffalo
Background
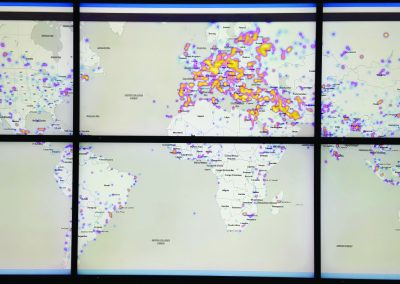
The global COVID-19 outbreak has deeply affected everyone’s daily life and constrained human mobility behaviors by preventive measures to mitigate the transmission. Different mass media channels and live location data streaming techniques have contributed to tracking the spread and predicting the trajectory of the pandemic developments. Moreover, the human mobility patterns hidden in these digital datasets – if properly interpreted- can document and reflect how people cope with the “paradoxical” daily activities when public life and social encounter are prohibited. In this research, we utilize the mobile location data collected at 2020 to date within Auckland city, New Zealand, to explore the social impacts on urban ‘hotspots’ concerning the transformation of social behaviors. The urban “hotspots” here refer to user-defined urban spaces with crowded human mobility and intensive social and economic activities regardless of their designated urban programs. We first construct the human-geographical networks and compare the pre and post COVID-19 pandemic human mobility patterns with respect to visitors’ density and diversity. By mapping the density and diversity patterns, we can capture and derive insights from urban “hotspots” spatial distribution changes to identify the adoptable urban space typologies that are quintessential places during the disruptive crisis. The research findings provoke a rethinking of our urban spaces design and planning strategies and contribute to better-informed decisions towards a resilient urban life environment while countries worldwide are slowly resuming normalcy.
Where are Auckland’s Urban “Hot-Spots”?
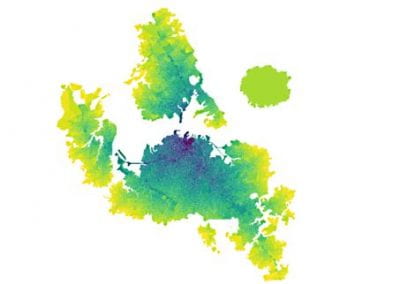
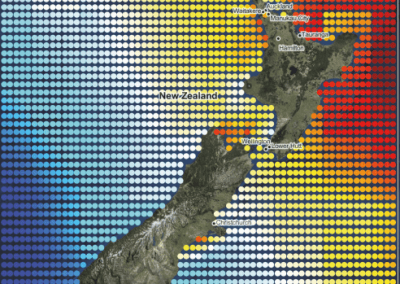
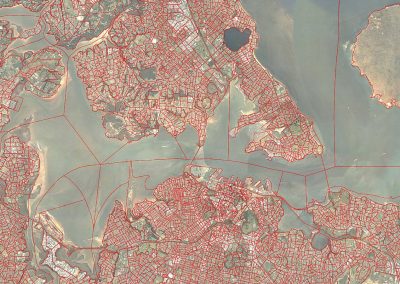
To demonstrate the importance of taking both density and diversity combined as a more objective and comprehensive approach. We visualize the “diversity” and “density” of visiting patterns separately to illustrate the vast difference of “density” and “diversity” pattern means in reference to visiting patterns of urban spaces (Figure 1). The “density” mapping reflects the population density of Auckland CBD and Manukau city, and high diversity areas are identified at the industrial and commercial clusters. These two concepts do not have a direct correlation, and we would argue that diversity measure is as critical, if not more than density, to be used as a valid index to identify urban “hotspots. As such, we take diversity as the key measure and density as a pre-request value in our analysis by excluding locations that do not have significant density and diversity.
Which leaves us with places that can potentially be considered as urban “hot-spots.” Upon the filtering steps, we begin analyzing the changing diversity distribution for the first 2 lockdown events- specifically, comparing the diversity distribution of 2 weeks before and after the 2 lockdown dates to understand the magnitude of the effect on the utilization pattern. However, this research aims to look for locations that had the capability to recover after the impact of the Covid-19 lockdown. We apply a ratio analysis comparing the changes before the second lockdown to the diversity after the first lockdown to helps us understand where the vibrancy has been returned across the city (Figure 2). Measure against the normal life pattern allows us to provide insights on the recovery of the urban places. And these vibrant places are what we call urban “hotspots.”
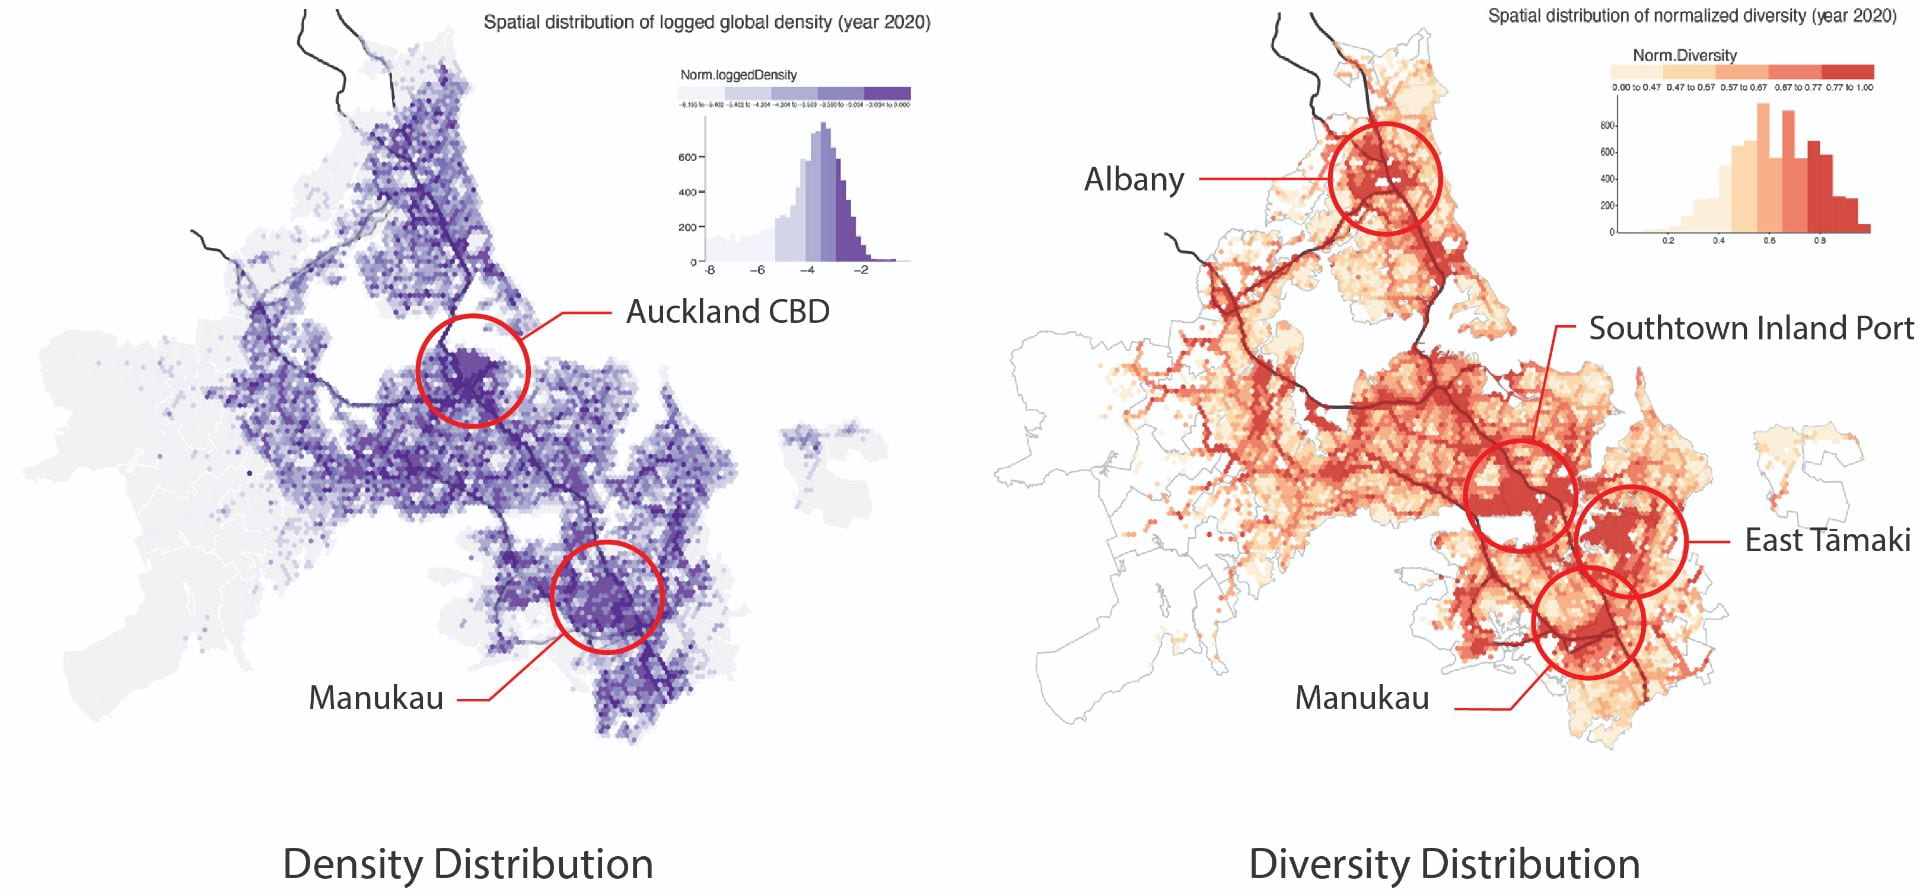
Figure 1. Density and Diversity of Utilization Patterns
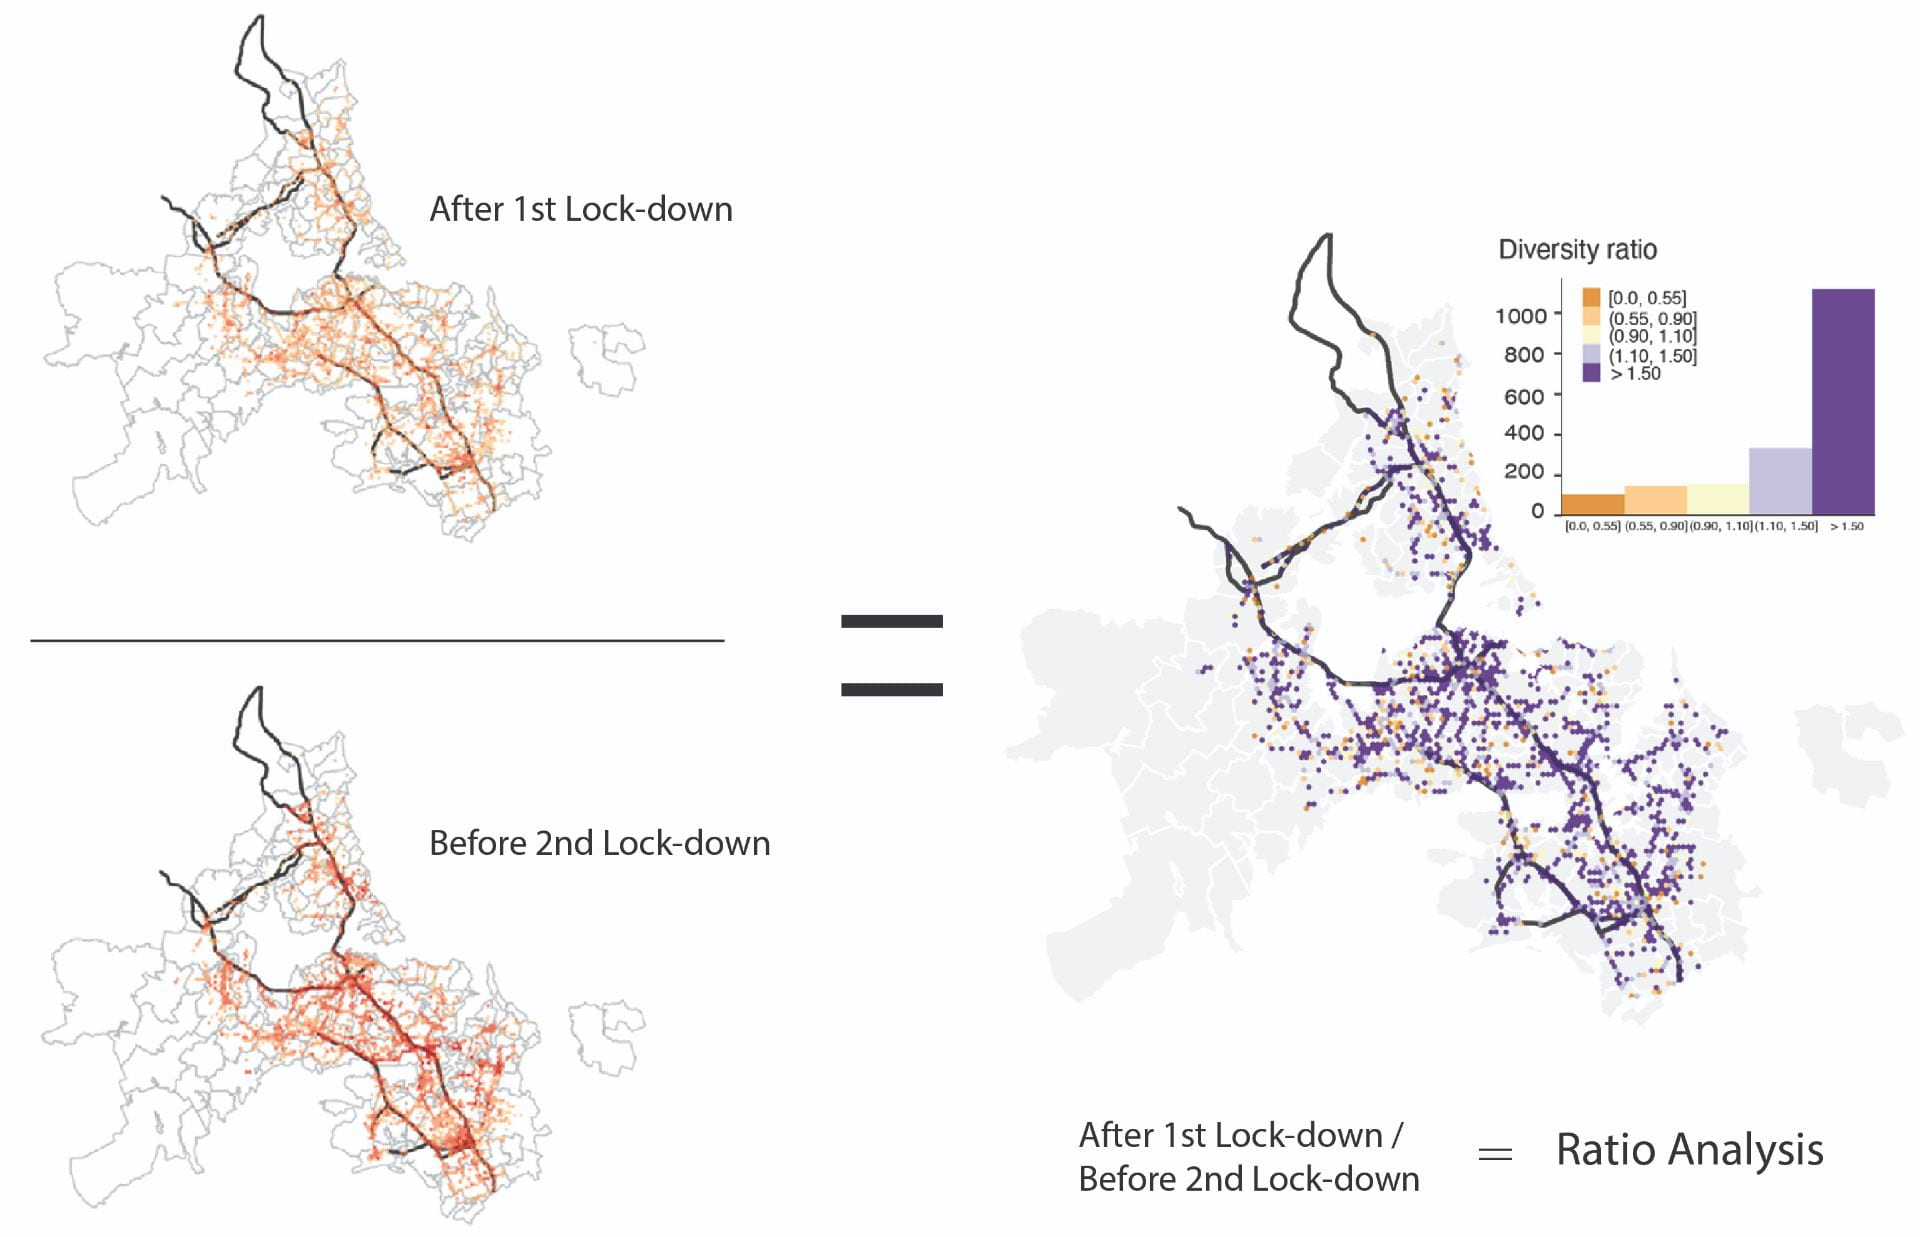
Figure 2. Ratio Analysis
As illustrated in Figure 3, by zooming into locations that have recovered with distinctive magnitude in the CBD area, we can identify locations that have returned to before covid utilization and places that are even more visited/used by diverse groups of people after the pandemic impact. These are places of essential urban programs (hospitals and highway on/off ramps) but predominantly urban parks in the city (Auckland Domain, Albert Park, a and Meyers park, etc.).
Urban “hotspots” under the impact of Covid are no longer only the popular places in the city but the “essential” spaces that recover quickly to support the changing dynamics of urban living. In Auckland, New Zealand, urban green parks are the predominant urban “hotspots” typology, which can be perceived as a critical urban tissue for the city’s future development while searching for the new norm of our urban life.
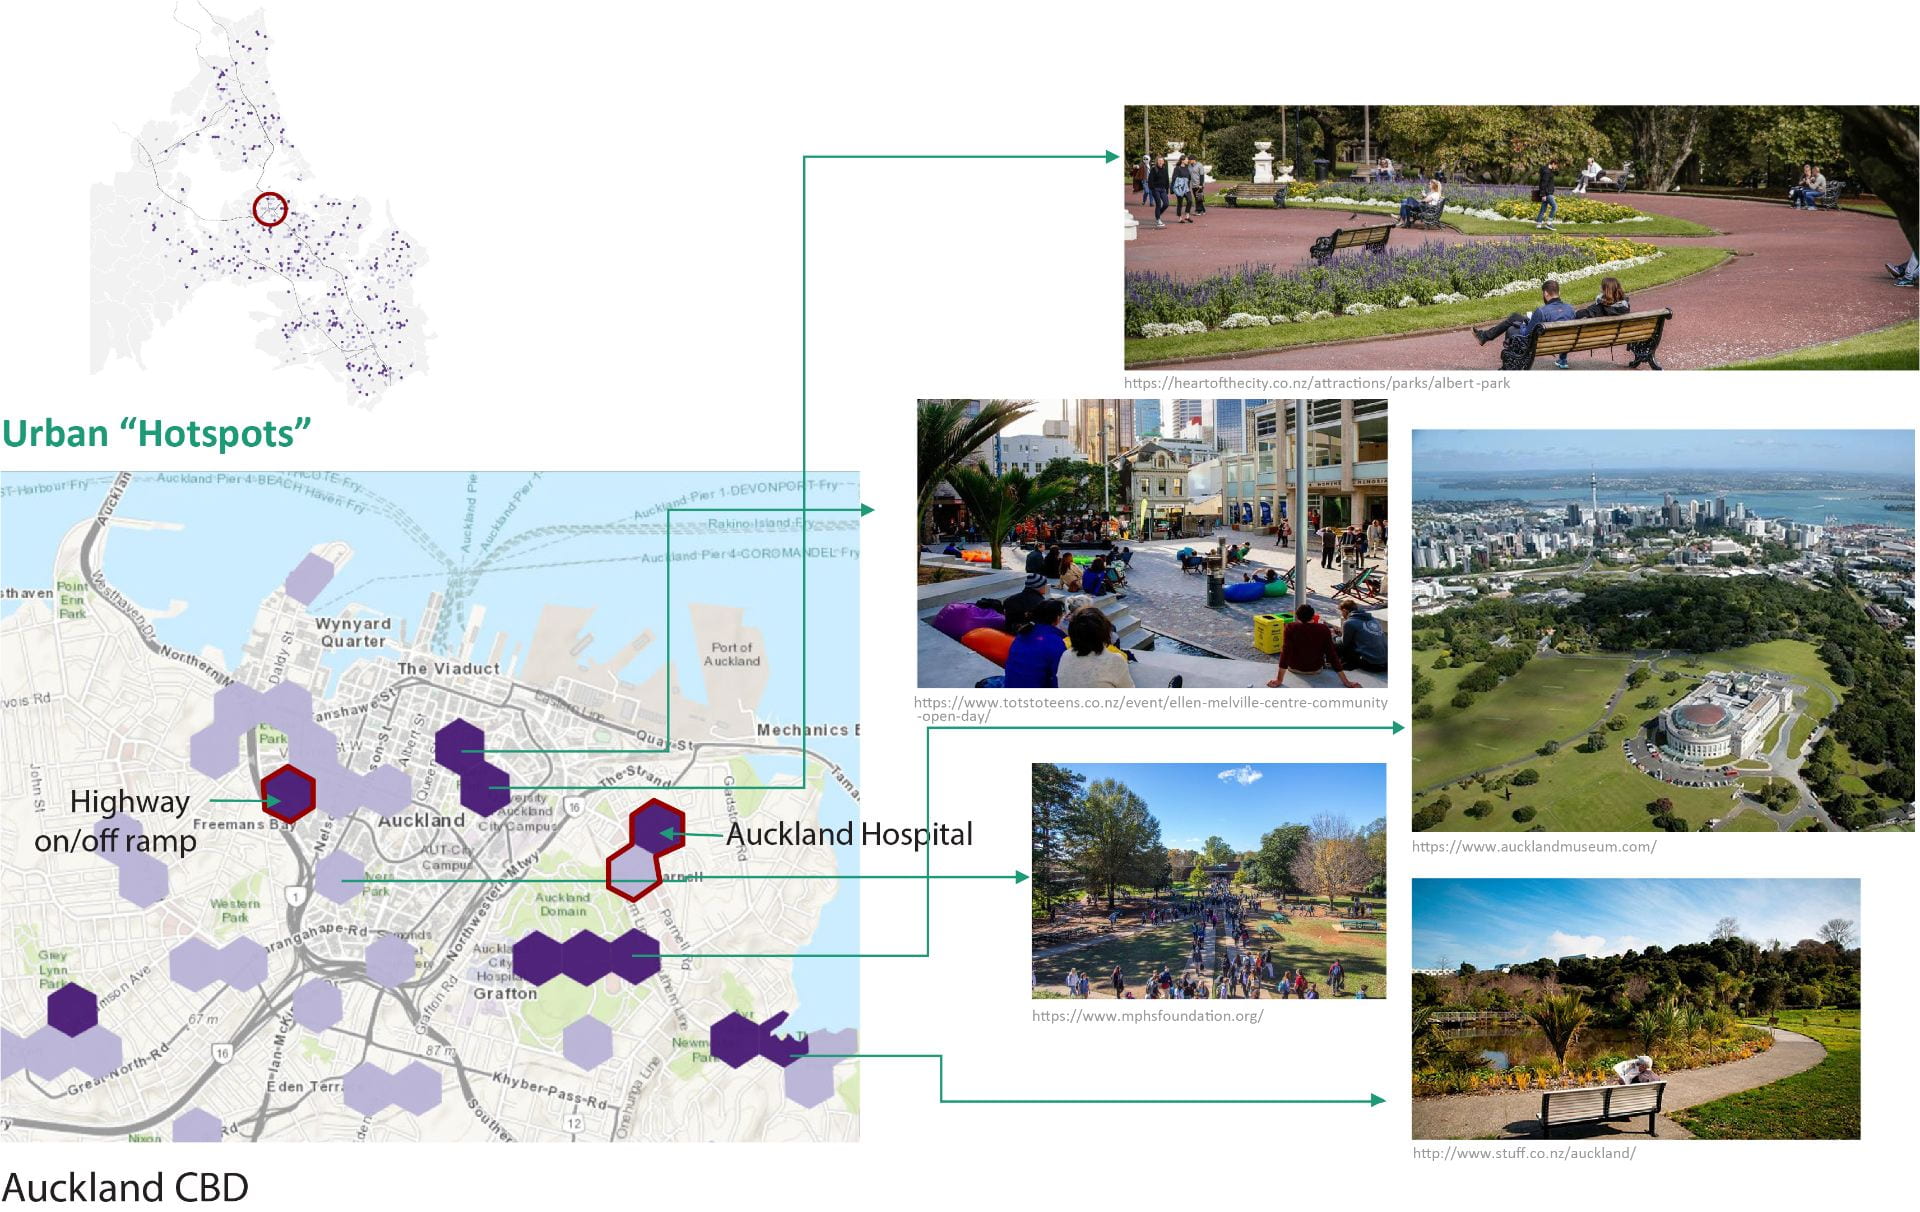
Figure 3. Auckland CBD Urban “Hotspots”
See more case study projects

Our Voices: using innovative techniques to collect, analyse and amplify the lived experiences of young people in Aotearoa
Painting the brain: multiplexed tissue labelling of human brain tissue to facilitate discoveries in neuroanatomy
Detecting anomalous matches in professional sports: a novel approach using advanced anomaly detection techniques

Benefits of linking routine medical records to the GUiNZ longitudinal birth cohort: Childhood injury predictors
Using a virtual machine-based machine learning algorithm to obtain comprehensive behavioural information in an in vivo Alzheimer’s disease model
Mapping livability: the “15-minute city” concept for car-dependent districts in Auckland, New Zealand
Travelling Heads – Measuring Reproducibility and Repeatability of Magnetic Resonance Imaging in Dementia
Novel Subject-Specific Method of Visualising Group Differences from Multiple DTI Metrics without Averaging
Re-assess urban spaces under COVID-19 impact: sensing Auckland social ‘hotspots’ with mobile location data
Aotearoa New Zealand’s changing coastline – Resilience to Nature’s Challenges (National Science Challenge)
Proteins under a computational microscope: designing in-silico strategies to understand and develop molecular functionalities in Life Sciences and Engineering
Coastal image classification and nalysis based on convolutional neural betworks and pattern recognition
Determinants of translation efficiency in the evolutionarily-divergent protist Trichomonas vaginalis
Measuring impact of entrepreneurship activities on students’ mindset, capabilities and entrepreneurial intentions

Using Zebra Finch data and deep learning classification to identify individual bird calls from audio recordings
Automated measurement of intracranial cerebrospinal fluid volume and outcome after endovascular thrombectomy for ischemic stroke
Using simple models to explore complex dynamics: A case study of macomona liliana (wedge-shell) and nutrient variations
Fully coupled thermo-hydro-mechanical modelling of permeability enhancement by the finite element method
Modelling dual reflux pressure swing adsorption (DR-PSA) units for gas separation in natural gas processing
Molecular phylogenetics uses genetic data to reconstruct the evolutionary history of individuals, populations or species
Wandering around the molecular landscape: embracing virtual reality as a research showcasing outreach and teaching tool
