Visualisation of paediatric bone geometry for use in bone measurement and musculoskeletal modelling tools
Dr Laura Carman, Snr Reseach Fellow, Auckland Bioengineering Institute
Background
Skeletal growth in children is a dynamic process influenced by biological and mechanical factors. Over half of skeletal growth occurs in early childhood, with significant changes continuing until growth plate fusion, which can extend up to 20 years of age 1. Typically developing (TD) children exhibit systematic bone modelling in terms of length, width, and version, while atypical development, such as in neuromuscular diseases, can alter skeletal modelling, impacting hip stability, gait, and limb alignment 2. Angular and torsional deformities are particularly relevant, as they can be exacerbated by altered mechanical loading and are often targeted in reconstructive surgeries 3. Increased femoral anteversion, for example, is frequently observed in conditions like hip dysplasia and cerebral palsy.
In a previous study, we collected 333 CT scans from TD children aged 4–18 years, extracted bone geometries, and developed an automated workflow to compute clinical bone measurements 4. We now aim to create a clinical tool to automatically display these bone measurements in an interactive way. This will provide clinicians with a more repeatable and robust method of clinical bone measurement determination and visualisation compared to current methods which include physical exams and individual slice selection from medical imaging data.
Research question
How can an interactive clinical tool be designed to effectively visualize 3D-derived bone measurements for improved clinical assessment and decision-making?

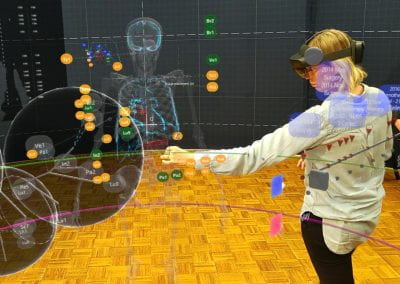
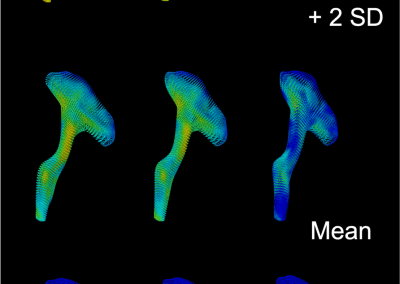
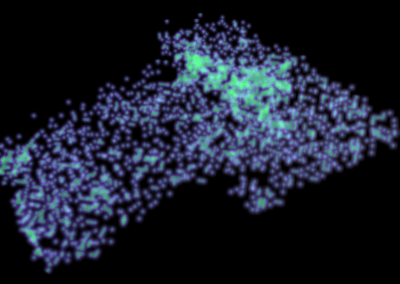
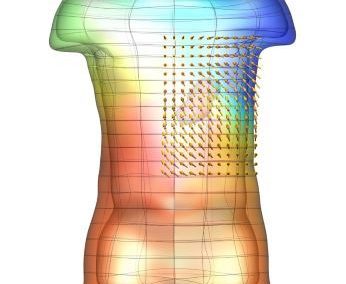
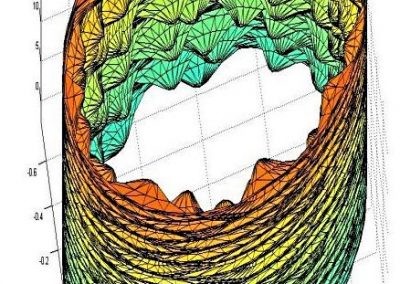
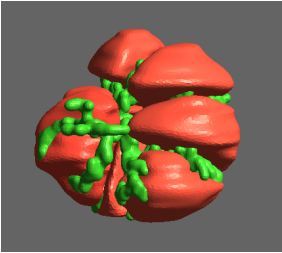
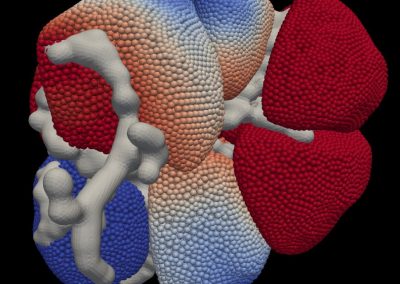
Figure 1: visualisation window showing 3d bone geometry, measurements, and landmarks
Outcome
The aim of this project was to create a visualisation tool for paediatric bone geometry, measurements, and landmarks as defined in a previous study by our group4. 3D bone geometries, bone measurement, and landmark data were provided to the visualisation tool. An interactive window was displayed for the user to view these values and toggle values on and off. The purpose of this study was to provide a visualisation tool for clinicians and researchers to view and understand bone measurement data for individuals with bony deformities.
Through this project, the python visualisation tool pyvista was used to visualise paediatric bone geometries, measurements, and landmarks. This tool can be found at: https://github.com/lauracarman/llbone_measurement_visualiser
Running the script gives the output seen in Figure 1. The user is then able to rotate the bone geometries within this window and toggle landmark and measurement values on and off. This provides a practical and efficient way for clinicians and researchers to view bone geometries of a patient as well as crucial clinical measurements including anteversion angle, neck shaft angle, and tibial torsion to assist in clinical decision making.
Future work on this tool will involve the automatic fitting of any 3D segmented bone geometry of the pelvis, femur, and tibia/fibula to a template shape model mesh. Automatic generation of bone measurements and landmarks can then be taken for this 3D bone geometry using already developed code and visualised using the tool developed by the Centre for eResearch for this project. This will all be packaged into a single tool for automatic calculation and display of bone measurements.
Key objectives
Building of preliminary visualisation tool to allow for user interaction and visualisation which allows for display of bone geometries for the pelvis, femur, and tibia/fibula using python. Decided the tool will be used as a python package rather than a web-based visualiser.
- Presentation at European computational methods and gait analysis conferences on similar work and networking conducted to establish uses of the tool.
- Landmarks and measurements were added to the tool.
- Toggle on/off capability added for the landmarks and measurements.
- Refinement of the definition of angles in the tool, drawing vectors between two defined points in 3d space rather than approximate lines.
- Added a gui which prompts the user to select the 3D bone geometry files and measurement data they want to display.
- Offset of the landmark labels so that they are not on top of the bone geometries.
- Consolidation of previously developed landmark and measurement code in preparation to be integrated into the visualisation tool at a later stage
- Overall, a visualisation tool has been created in python to view and interact with paediatric bone geometries and measurements in a 3D space.
Role of the Centre for eResearch
Working with the Centre for eResearch has been essential for the progress of this project. The extensive knowledge of visualisation tools and the ability to work within our requests has created a tool which can be used to assist clinicians in understanding a patients lower limb bone geometries and clinical measurements. This allowed for a project which otherwise would have sat around uncompleted to be turned into something that can be used beyond the bounds of a research paper.
Reference
J. A. Herring and M. O. Tachdjian, Tachdjian’s Pediatric Orthopaedics: from the Texas Scottish Rite Hospital for Children, 6th Edition, Sixth edit. Elsevier, 2020.
J. R. Gage, M. H. Schwartz, S. E. Koop, and T. F. Novacheck, The Identification and Treatment of Gait Problems in Cerebral Palsy, vol. 180–181, no. 2. 2009. doi: 10.1055/s-0037-1609054.
T. Amichai, N. Harries, Z. Dvir, H. Patish, and L. Copeliovitch, “The effects of femoral derotation osteotomy in children with cerebral palsy: An evaluation using energy cost and functional mobility,” Journal of Pediatric Orthopaedics, vol. 29, no. 1, pp. 68–72, 2009, doi: 10.1097/BPO.0b013e3181924331.
L. Carman, T. Besier, N. S. Stott, and J. Choisne, “Sex differences in linear bone measurements occur following puberty but do not influence femoral or tibial torsion,” Sci Rep, vol. 13, no. 1, p. 11733, Jul. 2023, doi: 10.1038/s41598-023