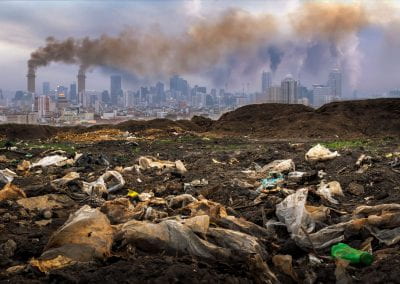
Climate change impacts on weather-related hazards
Associate Professor Giovanni Coco
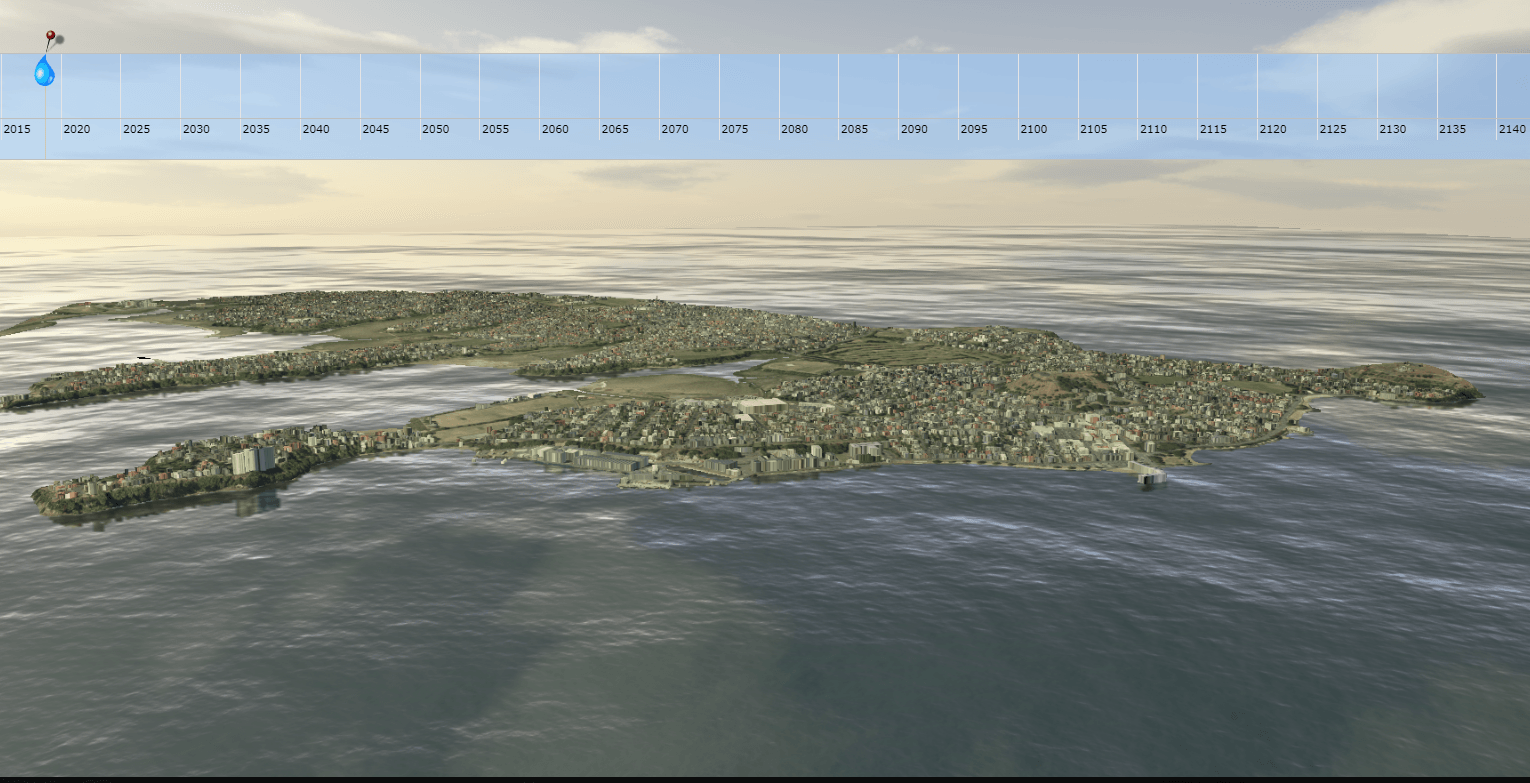
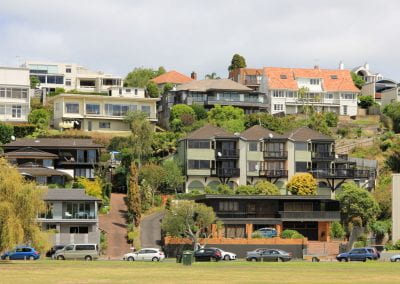
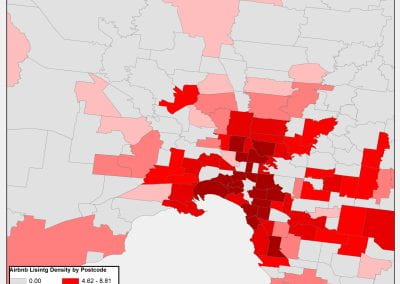
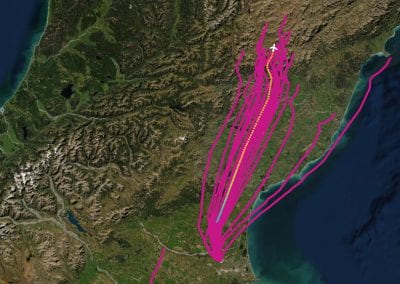
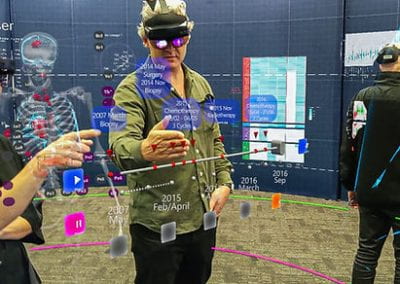
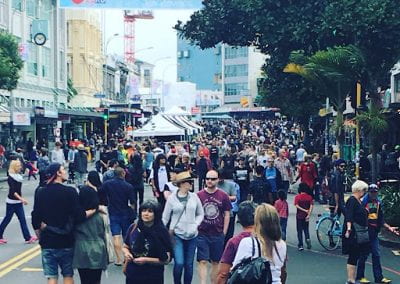
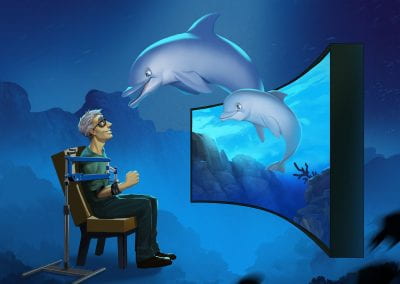
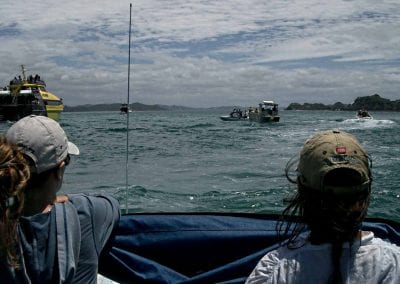
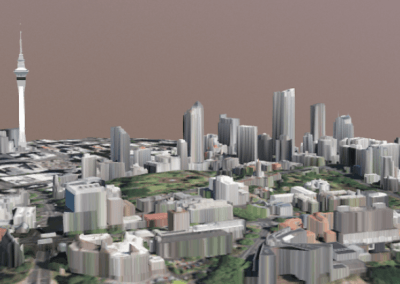
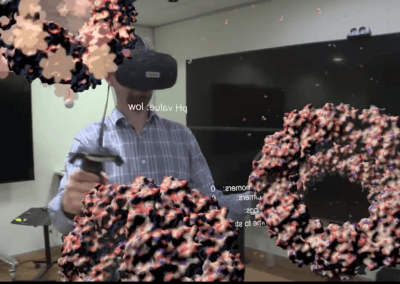
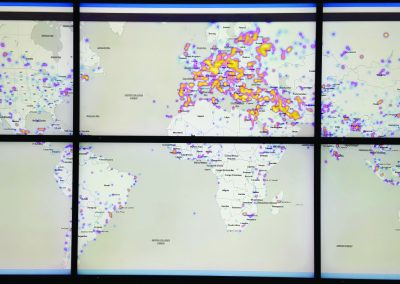
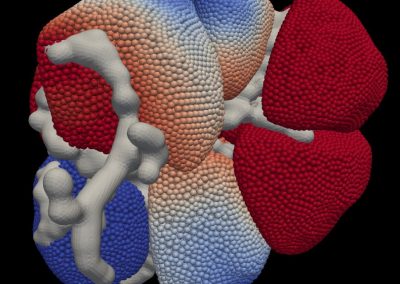
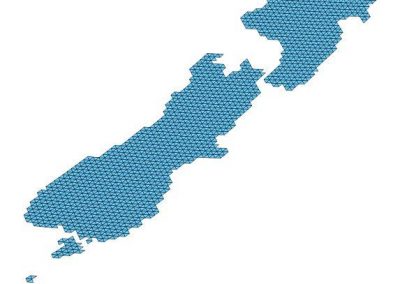
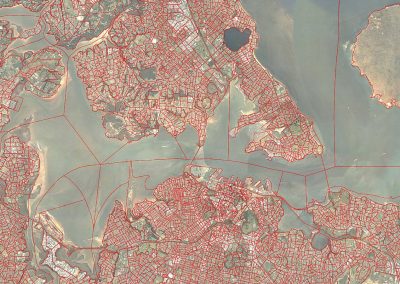
Figure 1. Coastal flooding – Auckland Harbour, Devonport and Tamaki Drive.
Overview
Adopting recent scientific developments, the project aims to develop a data-driven model framework to be implemented and tested in detail at specific case study sites (reflecting the diversity in New Zealand’s coastal characteristics), and to be used in studying multi-annual variability. It will generate a much finer scale (<10 km resolution) set of projections of nearshore wave and surge conditions spanning the next 100 years using state-of-the-art modelling approaches.
The project team use multi-model that is based on a statistical downscaling approach; incorporating weather-type classification and clustering techniques to project wave climate and storm surge. Each weather type is linked to sea wave conditions from a wave hindcast, and the relationship is used to project future changes in regional wave conditions from atmospheric pressure projections. Ultimately, the projection will be calculated at a scale of 10 km for the whole New Zealand coastline, and at an even finer scale (1 km) for the case studies.
Research objectives
There are 4 main objectives that the team aims to achieve by the end of 2019.
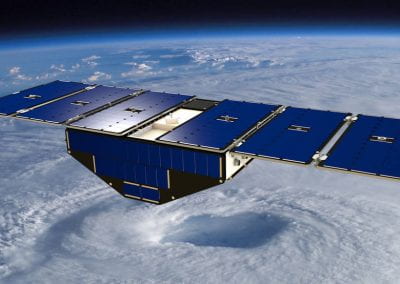
Wave climate and storm surge projections
Developed high resolution storm surge and wave re-analysis including correction of the wave hindcast using satellite data. Ultimately, the goal is to develop a high resolution (500 m – 1Km) coupled wave-surge hindcast for the case studies and climate change projections for coastal inundation and long-term morphodynamics using the climate emulator as well as sea level rise (SLR) projections.
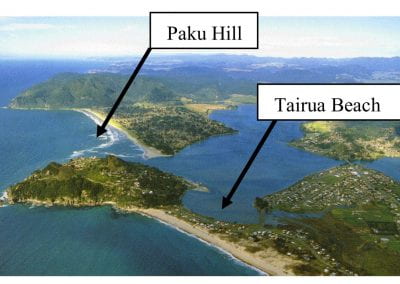
Coastal erosion
Through a collection of pre- and post-storm beach face erosion data from Muriwai/Ngarinui and Tairua Beach, the team also performed statistical analyses of shoreline and cliff dynamics to determine long-term trends and patterns. They will use wave projections from Objective 1 to project the shoreline behaviour.
Coastal inundation
The project team has set up and run multi-simulations of storm surges for synthetic bathymetries, and conducted preliminary tests; implemented GPS mapping of storm surge inundation using existing and new data modelling for Tauranga Harbour. Going forward, the team plan to use coastal storm surge climatologies to provide probabilistic predictions of storm surges in semi-enclosed coasts during climate change oscillations and the association with future climate change scenarios.
Coastal vulnerability
To identify and assemble biophysical and socio-economic data from the three case study sites and establish digital terrain models of the coastal compartments of each case study location as a baseline. The susceptibility index developed by NIWA was reviewed, and refined approach for each case study site to reflect spatial differences in coastal topography. The team will also evaluate the risk profile at each study location by combining and integrating erosion and inundation analysis with RiskScape. Assess and define the minimum data requirements for effective decision making.
In addition, these objectives are coupled with annual two-way interactions with coastal management end users. Lastly, to disseminate the methodology for analysis and use of climate projections via end-user workshops.
How the staff in Centre for eResearch (CeR) helped?
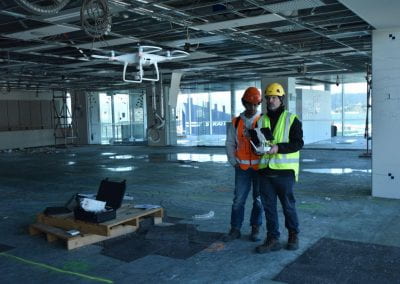
In order to achieve some of these objectives, Associate Professor Giovanni Coco has been working with the Centre for eResearch specialists to visualise the following scenarios by using the collected data and models described as below:
Storm surge
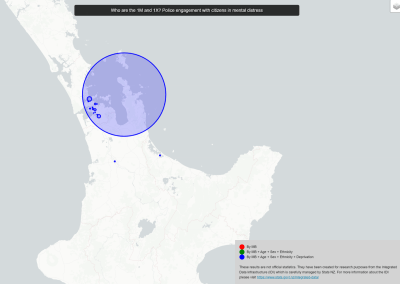
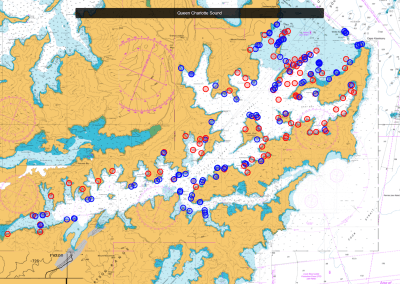
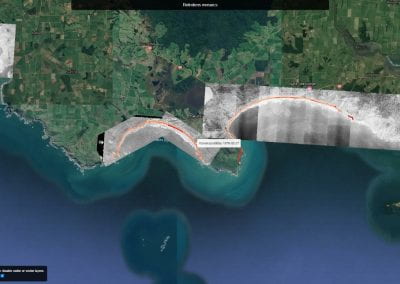
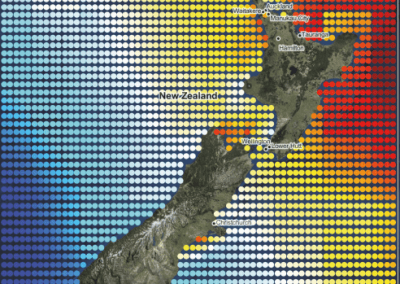
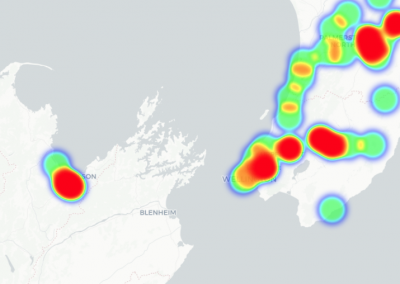
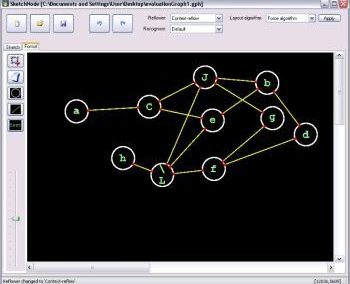
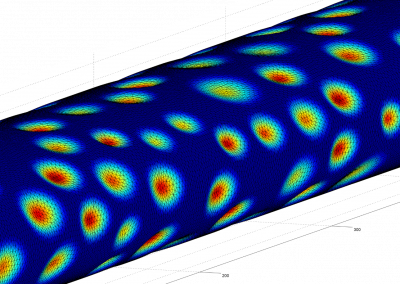
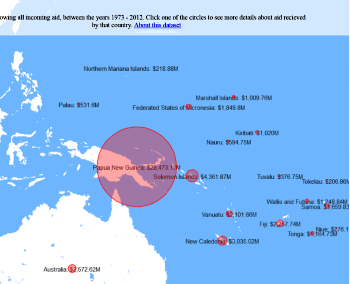
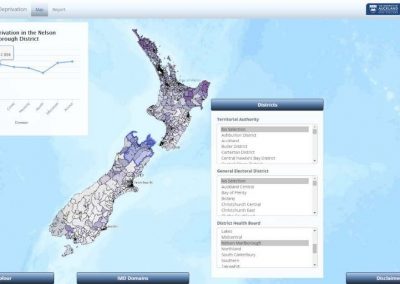
Nick Young from CeR then created an interactive web map where users can browse storm surge data across multiple models, locations and time from various institutions across different countries. Users can also export data from the model / area / time range of their choice. The map below (see figure 2) is a screenshot of the interactive web map.
Coastal flooding
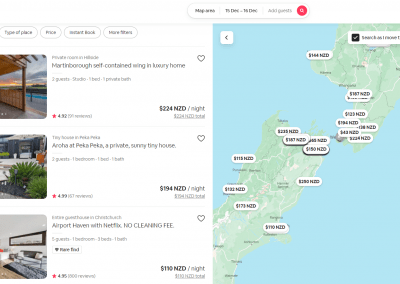
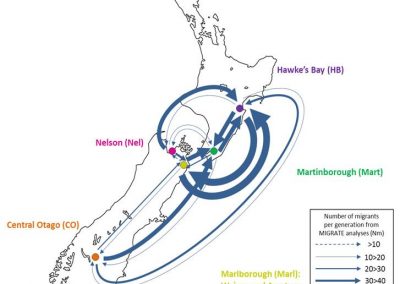
A simulation and interactive web page (see figure 1) were done by Bianca Haux from CeR, which allows exploration of sea level changes (including sea level rise, storm surge and tides) according to timeline adjustments combination with a user controlled animation which creates an impactful vision of the areas around Auckland Harbour, Devonport and Tamaki Drive. This 3D model was created by using Building Footprints, Digital Elevation Models and Imagery combined in Blender. The Three.js WebGL rendering was used to create the interactive 3D representation in the browser. The interactive timeline is based on Vis.js. The tool will allow storm events with tide cycles to be toggled on and off, in order to visualise the prediction of the worst case scenarios of the coastal inundation around these areas.

Figure 2. A screenshot from storm surge webpage, also see https://uoa-eresearch.github.io/storm_surge/
Modelling shoreline evolution
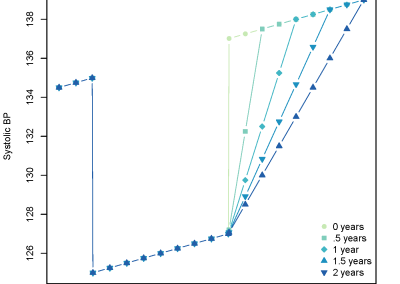
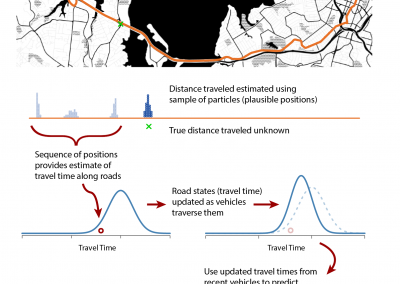
As part of the project objectives, Shoreshop 2018 – an international meeting of experts in coastal dynamics was hosted at the University of Auckland- researchers were invited to compete in a shoreline forecasting competition. The challenge was to predict shoreline evolution 3 years into the future using daily measurements of ocean wave height, period and direction.
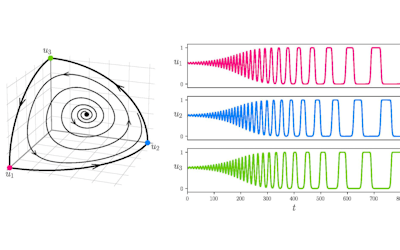
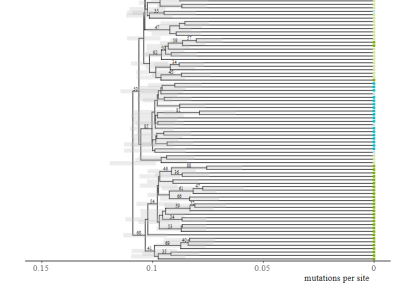
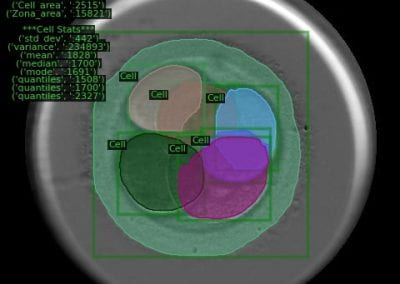
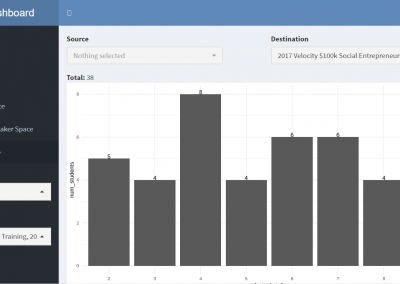
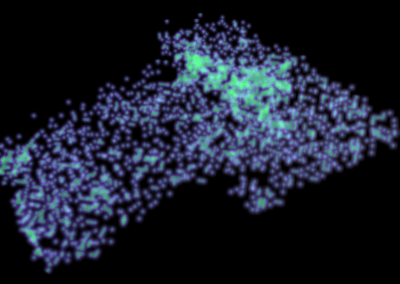
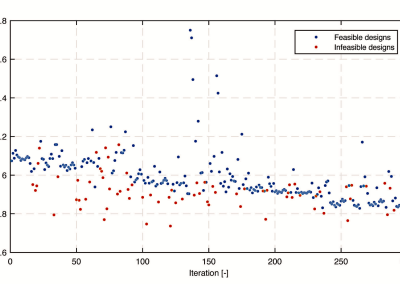
Sina Masoud-Ansari from CeR explored the application of machine learning techniques in forecasting shoreline evolution with the aim of improving the performance of prediction models (see figure 3). He presented on the use of machine learning method to solve this problem and won the first place in the machine learning category with results that were competitive with traditional process based models.

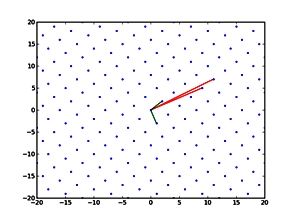
Figure 3. Predictions from the shoreline evolution model during model training (orange) and testing (green) along with final forecast (red). Actual measurements shown in blue.
Conclusion
The Natural Hazards Platform is hosted by Institute of Geological & Nuclear Sciences (GNS) together with NIWA. The researchers are expected to assist in implementing the communication aims by acknowledging collaboration, the use of Platform, sharing success stories, participate in Platform workshops and technical forums.
In addition, the research updates are required during natural hazard events for the purpose of sharing with MCDEM and/or MBIE Science & Innovation. With the visualisation capability added into the project allows all parties involved to visualise and share the information easier.