Coastal image classification and analysis based on convolutional neural betworks and pattern recognition
Assoc Professor Bo Liu1,2, Bin Yang1, Assoc Professor Giovanni Coco2*, Huina Wang1, Sina Masoud-Ansari2, Professor Mark Gahegan2
1University of Auckland, Auckland, New Zealand; 2Beijing University of Technology, Beijing, China
Abstract
The study of coastal processes is critical for the protection and development of beach amenities, infrastructure and properties. Many studies of beach evolution rely on data collected using remote sensing and show that beach evolution can be characterized by a finite number of “beach states”. However, due to practical constraints, long-term data displaying all beach states are rare. Also, when the dataset is available, the accuracy of the classification is not entirely objective since it depends on the operator. To address this problem, we have collected hourly coastal images and corresponding tidal data for more than 20 years (Nov. 1998 – Aug. 2019). We classified the coastal images into 8 categories according to the classic beach state classification, defined as 1) reflective, 2) incident scaled bar, 3) non-rhythmic, attached bar, 4) attached rhythmic bar, 5) offshore rhythmic bar, 6) non-rhythmic, 3-D bar, 7) infragravity scaled 2-D bar, 8) dissipative. Classification models are usually based on convolutional neural networks. After image pre-processing with data enhancement, we have compared DenseNet, ResNet, ResNext and improved ResNext models. The improved ResNext obtained the best and most stable classification with an accuracy of 94.58% and good generalization ability. The classification results of the whole dataset are transformed into time series data. FP-Growth and MDLats algorithms are used to find frequent patterns and motifs which represent the pattern of coastal morphology changes within a certain period of time. Combining the pattern of coastal morphology change and the corresponding tidal data, we also analyzed the characteristics of beach morphology and the changes in morphological dynamics states.

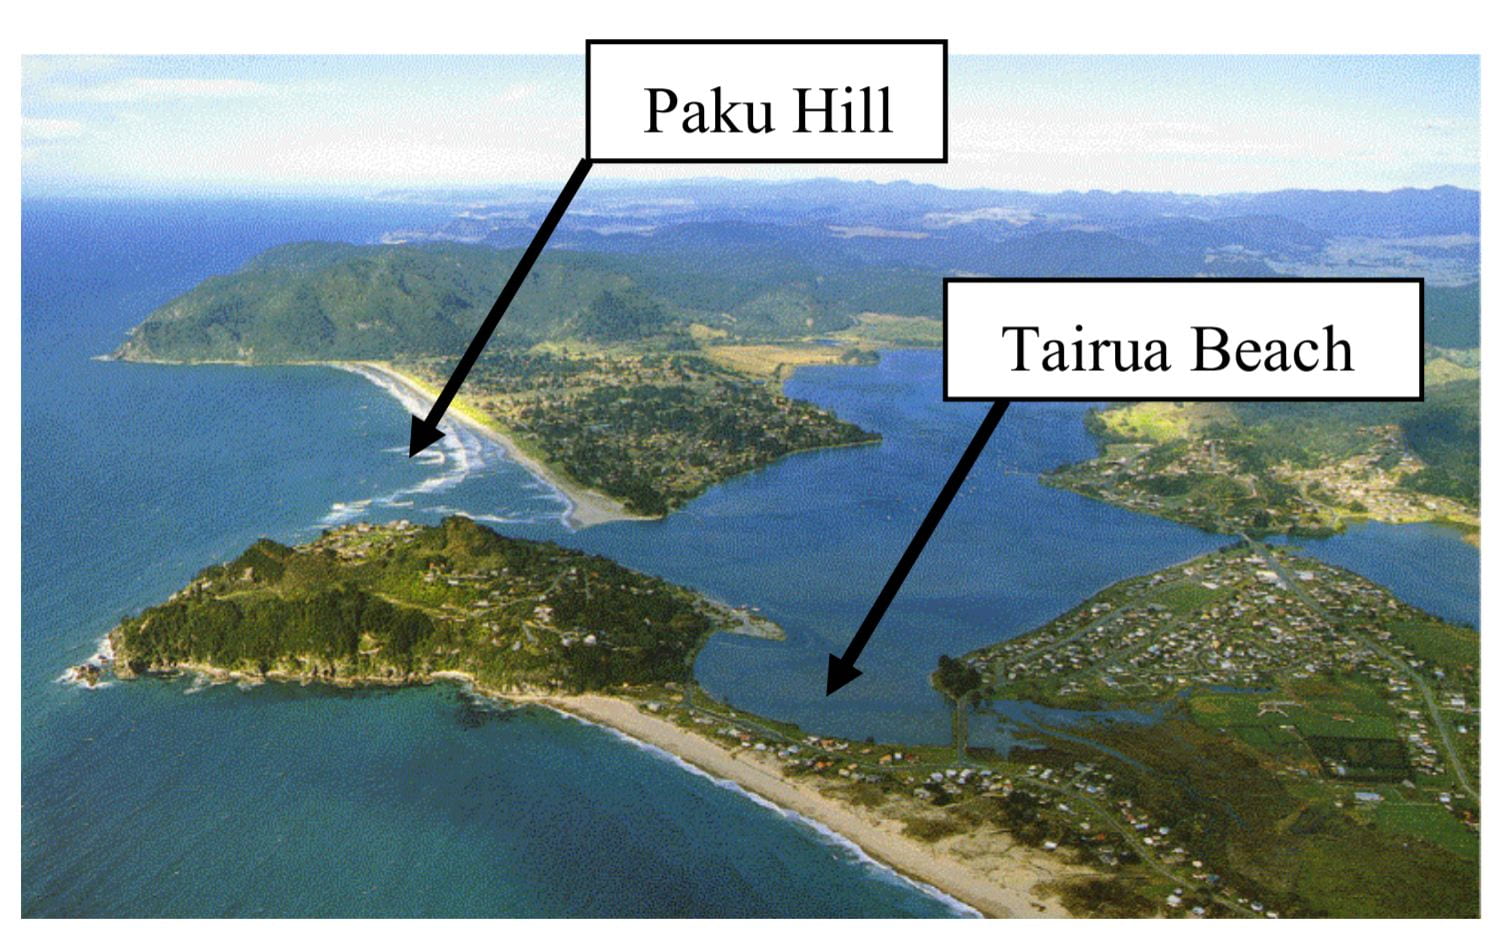
Figure 1. The location of Tairua Beach
Introduction
The change of beach shape is mainly controlled by interactions involving the coupling of hydrodynamics and morphodynamics. The study of waves and tides has important guiding significance for the protection and development of the beach. However, due to practical constraints, long-term data displaying all beach states are rare. To resolve this problem, we have collected hourly coastal images and corresponding tidal data for more than 20 years (Nov. 1998 – Aug. 2019). Moreover, the deep learning technologies are utilized to realize the classification of coastal images, and the pattern recognition methods are conducted to analyse the evolution process and transition rules of the beach.
Dataset
Tairua Beach is located on the east coast of the Coromandel Peninsula in the North Island of New Zealand, which is characterized by the typical “pocket beach” configuration1. Since 1998, a video monitoring station was installed on the extinct volcano at the south end of the beach. It collected images over a period of 20 minutes every hour. There are 103,660 images in this dataset during Nov. 1998 – Aug. 2019. Lippmann and Holman2 had proposed a typical classification method for sandbars. Considering nearshore morphology, the coastal images have been classified into 8 categories2, defined as 1) reflective, 2) incident scaled bar, 3) non-rhythmic, attached bar, 4) attached rhythmic bar, 5) offshore rhythmic bar, 6) non-rhythmic, 3-D bar, 7) infragravity scaled 2-D bar, 8) dissipative. In our dataset, 3,744 images are labelled according to Lippmann and Holman’s classification criteria.
Tables 1-2 show the experimental results with regard to Top-1 Accuracy and F1-score. Comparing the accuracy of ResNet50 and ResNext50, it is clearly to find that Top-1 accuracy obtained by using Resnext50 can achieve higher accuracy than that obtained by ResNet50. Compared with the same network before and after using image enhancement, we can find that the accuracy of the two methods is improved by 4.7% and 3.1%, respectively.
Coastal image classification
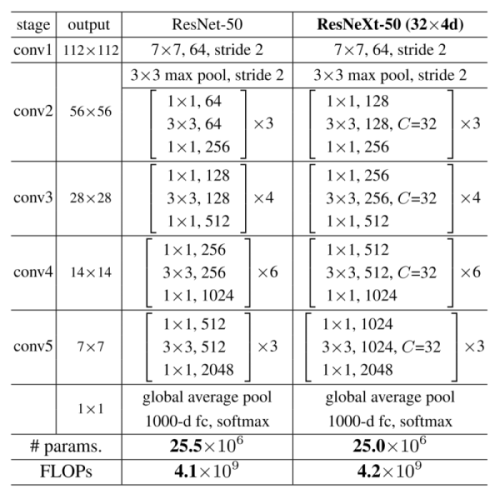
For the coastal images classification, we have compared ResNe3and ResNext4models based on Convolutional Neural Networks. The network structures of ResNet50 and ResNext50 models are shown in Fig. 2.

Figure 2. Network structure of ResNet50 and ResNext50

Table 1. Comparison of test results with different models

Table 2. F1-score of different models in each category
Sequential pattern mining of classification results
Then, the classification results from A-H are then converted to numbers 0-7. We obtained a time series corresponding to the sandbar state in each hour. For sequential pattern mining, we have adopted three methods. 1) FP-Growth5 is a typical association method, in which the database of frequent itemsets is compressed into a frequent schema tree to efficiently discover frequent itemsets. 2) PrefixSpan6 is also an association algorithm for mining frequent sequential patterns, which projects the original data based on prefixes and constantly combines prefixes and outputs patterns that satisfy minimum support. 3) MDLats is a proposed motif discovery algorithm to mine frequent patterns from time series data.
Fig. 3 represents the variation of bar type and tidal height over a month. The red line stands for the hourly states, while the blue line stands for the tidal height. The blue square marked some similar patterns discovered.

Figure 3. Variation of bar type and tidal height
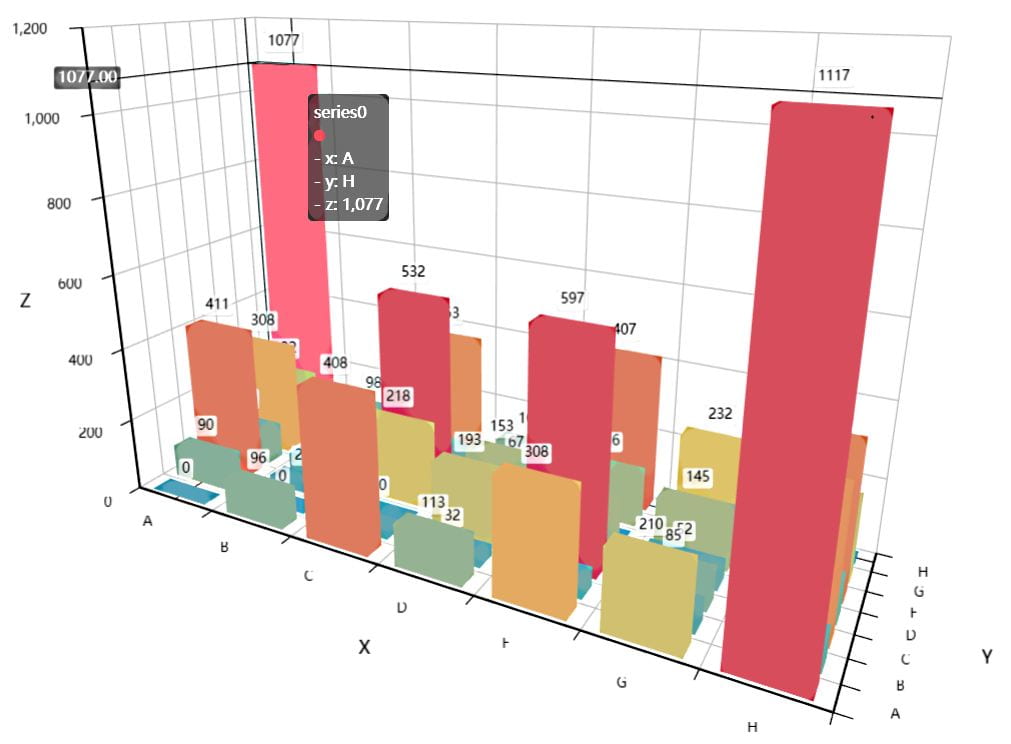
Fig. 4 shows the transitions between morphologic bar types. X coordinate represents the initial type; Y represents the destination type after transition; Z represents the number of type transitions. From this figure, it can be seen that the transitions from type A to type H occur 1077 times.
Conclusions
In this study, the morphology in the coastal image is divided into 8 categories. The results of ResNet and ResNext are compared. ResNext achieved 98.9% of the best and most stable classification accuracy and the model had good generalization ability. The prediction classification results of the whole dataset are converted into time series. We have utilized FP-Growth, PrefixSpan and MDLats algorithms to discover frequent patterns and motifs that represent the regularity of coastal morphology change in a certain period. Combined with the variation of coastal morphology and the corresponding tidal data, the variation of beach morphology and morphological dynamics is analyzed and discussed.

Figure 4. Transitions between morphologic bar types
References
- I. van de Lageweg, K.R. Bryan, G. Coco, et al. Observations of shoreline–sandbar coupling on an embayed beach. Marine Geology, Vol. 344, p 101-114, 2013.
- C. Lippmann, R.A. Holman. The spatial and temporal variability of sand bar. J. Geophys. Res., Vol. 95, 1990.
- He, X. Zhang, S. Ren, J. Sun. Deep residual learning for image recognition. In CVPR, 2016.
- Xie, R. Girshick, P. Dollar, Z. Tu, K. He. Aggregated residual transformations for deep neural networks. In CVPR, 2017.
- W. Han, J. Pei, B. Mortazavi-Asl, et al. Freespan: Frequent pattern-projected sequential pattern mining. In Proc. 2000 Int. Conf. Knowledge Discovery and Data Mining (KDD’00), 2000.
- Pei, J.W. Han, B. Mortazavi-Asl, et al. Prefixspan: Mining sequential patterns efficiently by prefix-projected pattern growth. In proceedings of the 17th international conference on data engineering, 2001.