Estimating quality of life: a spatial microsimulation model of wellbeing in Aotearoa New Zealand
Dr Jesse Wiki, School of Population Health; Assoc Professor Daniel Exeter, School of Population Health; Dr Nelis Drost, Centre for eResearch
Introduction
Understanding quality of life is important for many reasons, both at an individual and societal level. Governments and policymakers use quality of life indicators to assess the wellbeing of populations. This information informs policy decisions related to healthcare, education, social services, and infrastructure development. Understanding disparities among different demographic groups (e.g., based on income, ethnicity, gender, or location) can also help to promote equity. Researchers in various fields, including geography, public health, sociology, psychology, and economics, study quality of life to gain insights into human behaviour, happiness, and wellbeing. This contributes to our understanding of human flourishing. In this research, we focused on wellbeing as an indicator of quality of life. While there are some surveys that collect information on wellbeing in Aotearoa New Zealand, these are typically only for certain geographic areas or small groups of the population. While this provides some insight into wellbeing, it does not allow for a nationwide understanding. However, a nationwide understanding of wellbeing is crucial for policymakers, researchers, and the general public to make informed decisions and address disparities effectively. Therefore, our aim was to create a nationwide dataset that can be used to understand wellbeing in Aotearoa New Zealand.
Methodology
Individual-level data on 47,949 adults was sourced from the New Zealand Attitudes and Values Study (NZAVS)1. This provided information on personal wellbeing and national wellbeing. Personal wellbeing is comprised of 1) your health, 2) your standard of living, 3) your future security, and 4) your personal relationships, while national wellbeing is comprised of 1) the economic situation in Aotearoa New Zealand, 2) the social conditions in Aotearoa New Zealand, and 3) business in Aotearoa New Zealand. Survey respondents provide scores for the above ranging from 0 to 10 (extremely dissatisfied–extremely satisfied). We also used area-level data on 3,775,854 adults from the Census. To connect these two datasets, we used five linking variables: age, sex, ethnicity, highest qualification, and labour force status. We then employed a spatial microsimulation approach to model this data. This approach has rarely been used in previous research from Aotearoa New Zealand, but provides a useful way to create nationwide data that can be used to understand population outcomes. Using this modelling approach, we combined the individual-level survey data from the NZAVS with area-level data from the Census to produce a nationwide synthetic dataset. A synthetic dataset is artificially generated rather than collected through direct observation or measurement of real-world data. Creating a synthetic dataset involves understanding the statistical properties and relationships present in real-world data and then designing algorithms or models to replicate those characteristics. The main purpose of a synthetic dataset is to provide a substitute for real-world data when actual data might be unavailable, insufficient, or sensitive to share.
Outcomes
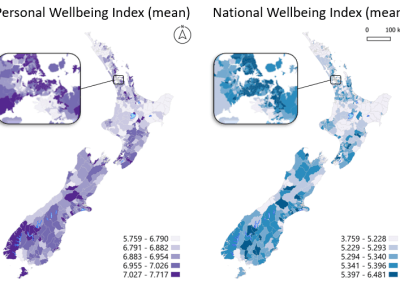
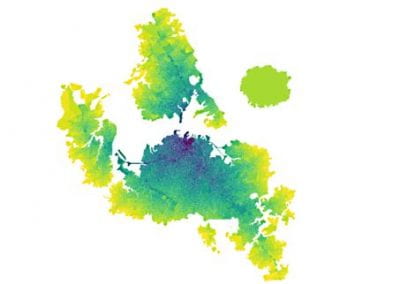
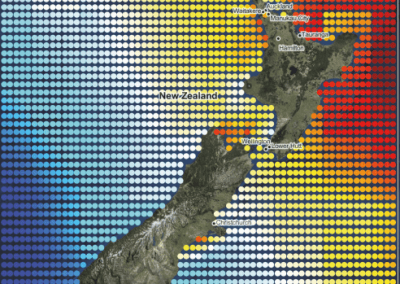
Key findings show that there are lower national wellbeing scores than personal wellbeing scores overall, and there are spatial variations that broadly reflect patterns of socioeconomic deprivation (Figure 1). Areas of high socioeconomic deprivation were typically highlighted as those with low wellbeing scores while areas of low socioeconomic deprivation were typically highlighted as those with high wellbeing scores. Additionally, low wellbeing scores for both personal and national wellbeing measures were most evident in rural areas of high socioeconomic deprivation, particularly those with large Māori populations. In contrast, central business areas and rural areas of low socioeconomic deprivation, particularly those with high European populations such as central and southern areas of the South Island, showed a distinctly different spatial pattern. In such areas, personal wellbeing was generally moderate to high and national wellbeing was high. While such findings are not unexpected, it is important to take into consideration what is included in these measures of wellbeing. It is also important to recognise that some aspects of these measures, such as personal relationships, extend far beyond the home environment into the community, workplace environments, and educational environments.
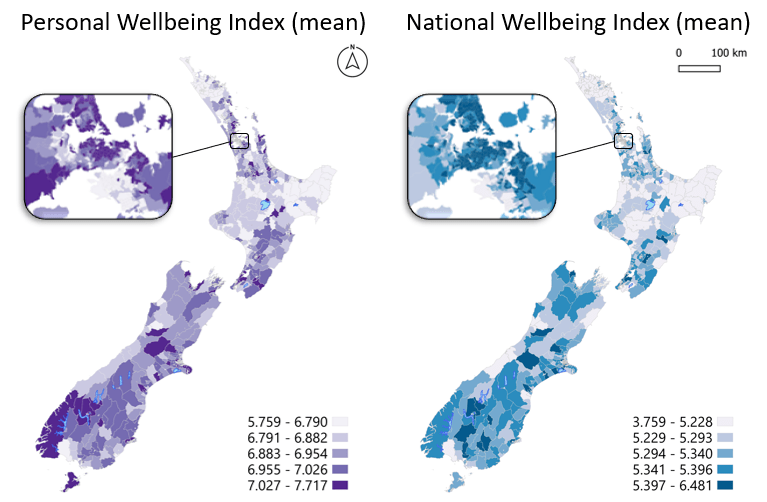
Figure 1. Spatial microsimulation results of Personal and National Wellbeing at Statistical Area 2 level
Final thoughts
This study has demonstrated not only a nationwide understanding of wellbeing in Aotearoa New Zealand, but also the potential of spatial microsimulation modelling in population health research. Where nationwide data does not exist or is unavailable, spatial microsimulation can be used to model a synthetic population based on existing data. This presents a major advancement in the development of models that can be used to inform spatially relevant policy interventions in a timely fashion.
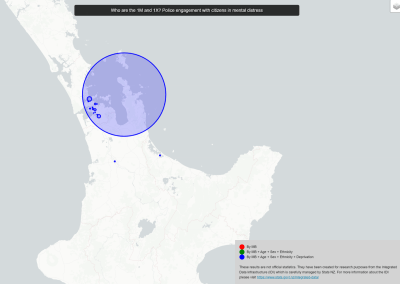
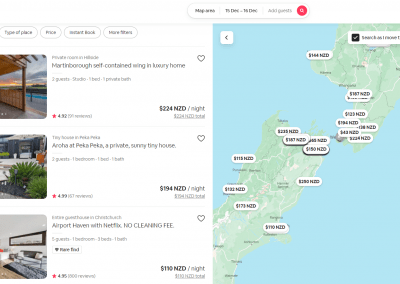
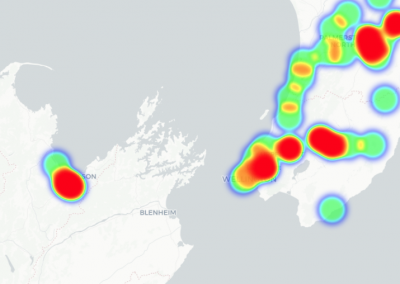
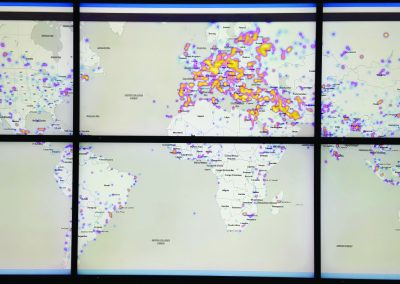
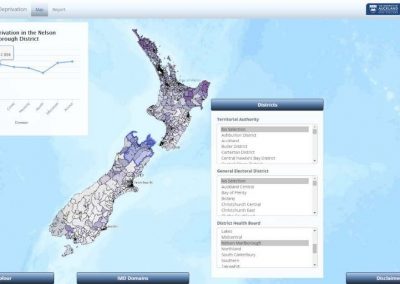
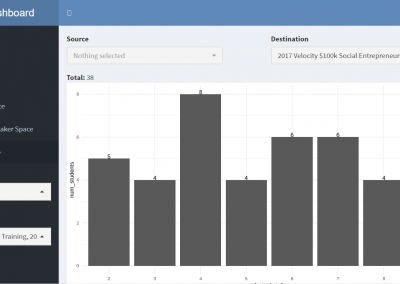
An important aspect of this work was to make it accessible to other researchers, policy-makers and the community. The Centre for eResearch has made this possible by creating an interactive map (Figure 2) that allows for the examination of results. This is hosted on GitHub and available from the following link: https://uoa-eresearch.github.io/spatial-microsimulation-visualisation/.
This work was published in Social Science and Medicine, Volume 330, August 2023 (https://doi.org/10.1016/j.socscimed.2023.116054)
Peferences:
1 Sibley, C. G. (2023). New Zealand Attitudes and Values Study. https://www.psych.auckland.ac.nz/en/about/new-zealand-attitudes-and-values-study.html
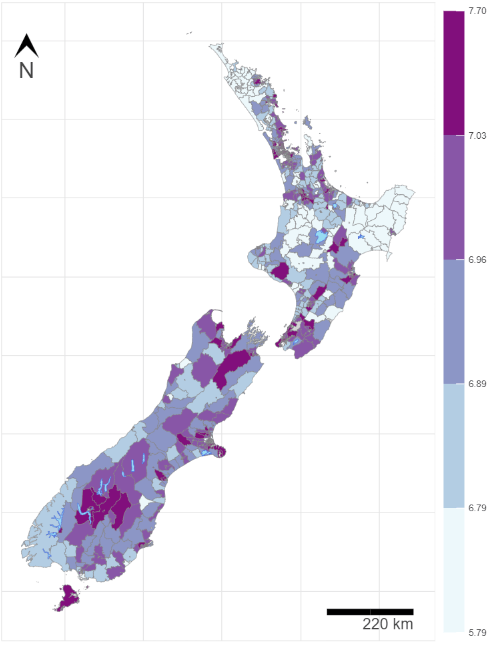
Figure 2. An example of interactive dashboard for spatial microsimulation results.
See more case study projects

Our Voices: using innovative techniques to collect, analyse and amplify the lived experiences of young people in Aotearoa
Painting the brain: multiplexed tissue labelling of human brain tissue to facilitate discoveries in neuroanatomy

Detecting anomalous matches in professional sports: a novel approach using advanced anomaly detection techniques

Benefits of linking routine medical records to the GUiNZ longitudinal birth cohort: Childhood injury predictors
Using a virtual machine-based machine learning algorithm to obtain comprehensive behavioural information in an in vivo Alzheimer’s disease model
Mapping livability: the “15-minute city” concept for car-dependent districts in Auckland, New Zealand
Travelling Heads – Measuring Reproducibility and Repeatability of Magnetic Resonance Imaging in Dementia
Novel Subject-Specific Method of Visualising Group Differences from Multiple DTI Metrics without Averaging
Re-assess urban spaces under COVID-19 impact: sensing Auckland social ‘hotspots’ with mobile location data
Aotearoa New Zealand’s changing coastline – Resilience to Nature’s Challenges (National Science Challenge)

Proteins under a computational microscope: designing in-silico strategies to understand and develop molecular functionalities in Life Sciences and Engineering
Coastal image classification and nalysis based on convolutional neural betworks and pattern recognition
Determinants of translation efficiency in the evolutionarily-divergent protist Trichomonas vaginalis
Measuring impact of entrepreneurship activities on students’ mindset, capabilities and entrepreneurial intentions

Using Zebra Finch data and deep learning classification to identify individual bird calls from audio recordings
Automated measurement of intracranial cerebrospinal fluid volume and outcome after endovascular thrombectomy for ischemic stroke
Using simple models to explore complex dynamics: A case study of macomona liliana (wedge-shell) and nutrient variations
Fully coupled thermo-hydro-mechanical modelling of permeability enhancement by the finite element method
Modelling dual reflux pressure swing adsorption (DR-PSA) units for gas separation in natural gas processing
Molecular phylogenetics uses genetic data to reconstruct the evolutionary history of individuals, populations or species

Wandering around the molecular landscape: embracing virtual reality as a research showcasing outreach and teaching tool


