A new ‘stratigraphy’: interpreting object relationships with 3D point densities
Dr Joshua Emmit, Rebecca Phillips, Simon Holdaway, Department of Anthropology; Sina Masoud-Ansari, Centre for eResearch
Introduction
Recording stratigraphic layers as a means for grouping archaeological phenomena into units dates back to the foundation of archaeology. Part of the craft of archaeology involves recognizing changes in sediment colour and composition, and the resultant need to change stratigraphic layer designation. Such changes are illustrated in stratigraphic diagrams that form a key part of the majority of archaeological site reports. Artefacts are then often assigned to these units which are used to understand artefact deposition, assemblage composition, and ultimately human behavior. Despite the history and centrality of stratigraphy to archaeological practice, stratigraphic recording has seen surprisingly little innovation and scrutiny. While some recent attempts have been made to rectify this, drawing stratigraphy continues to be as much an art as science. Learning how to draw stratigraphy is often seen as part of an ‘apprenticeship’ in archaeological methods. We collaborated with the Center for eResearch to propose an alternative to traditional stratigraphy by presenting a method for an object-oriented approach that utilizes 3D point densities to identify groups of objects.
Methods and materials
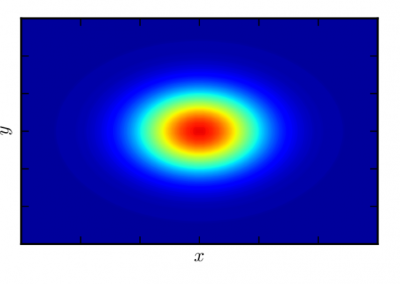
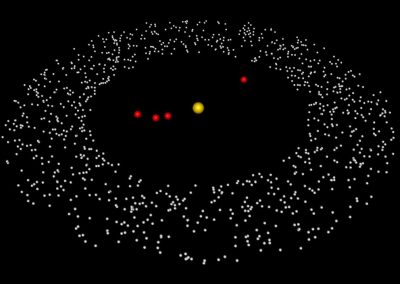
Some attempts have been made to apply three-dimensional (3D) point densities to archaeological interpretation, but have failed to be adopted as a mainstream analytical technique. In many cases, a lack of appropriate data may be the cause of this, but additional considerations are the relative difficulty of constructing 3D densities compared to 2D densities available in many GIS packages, and the inability to relate the resulting 3D densities to GIS data. Part of this issue is that 3D densities currently require volumetric rendering, which are not supported in GIS environments.
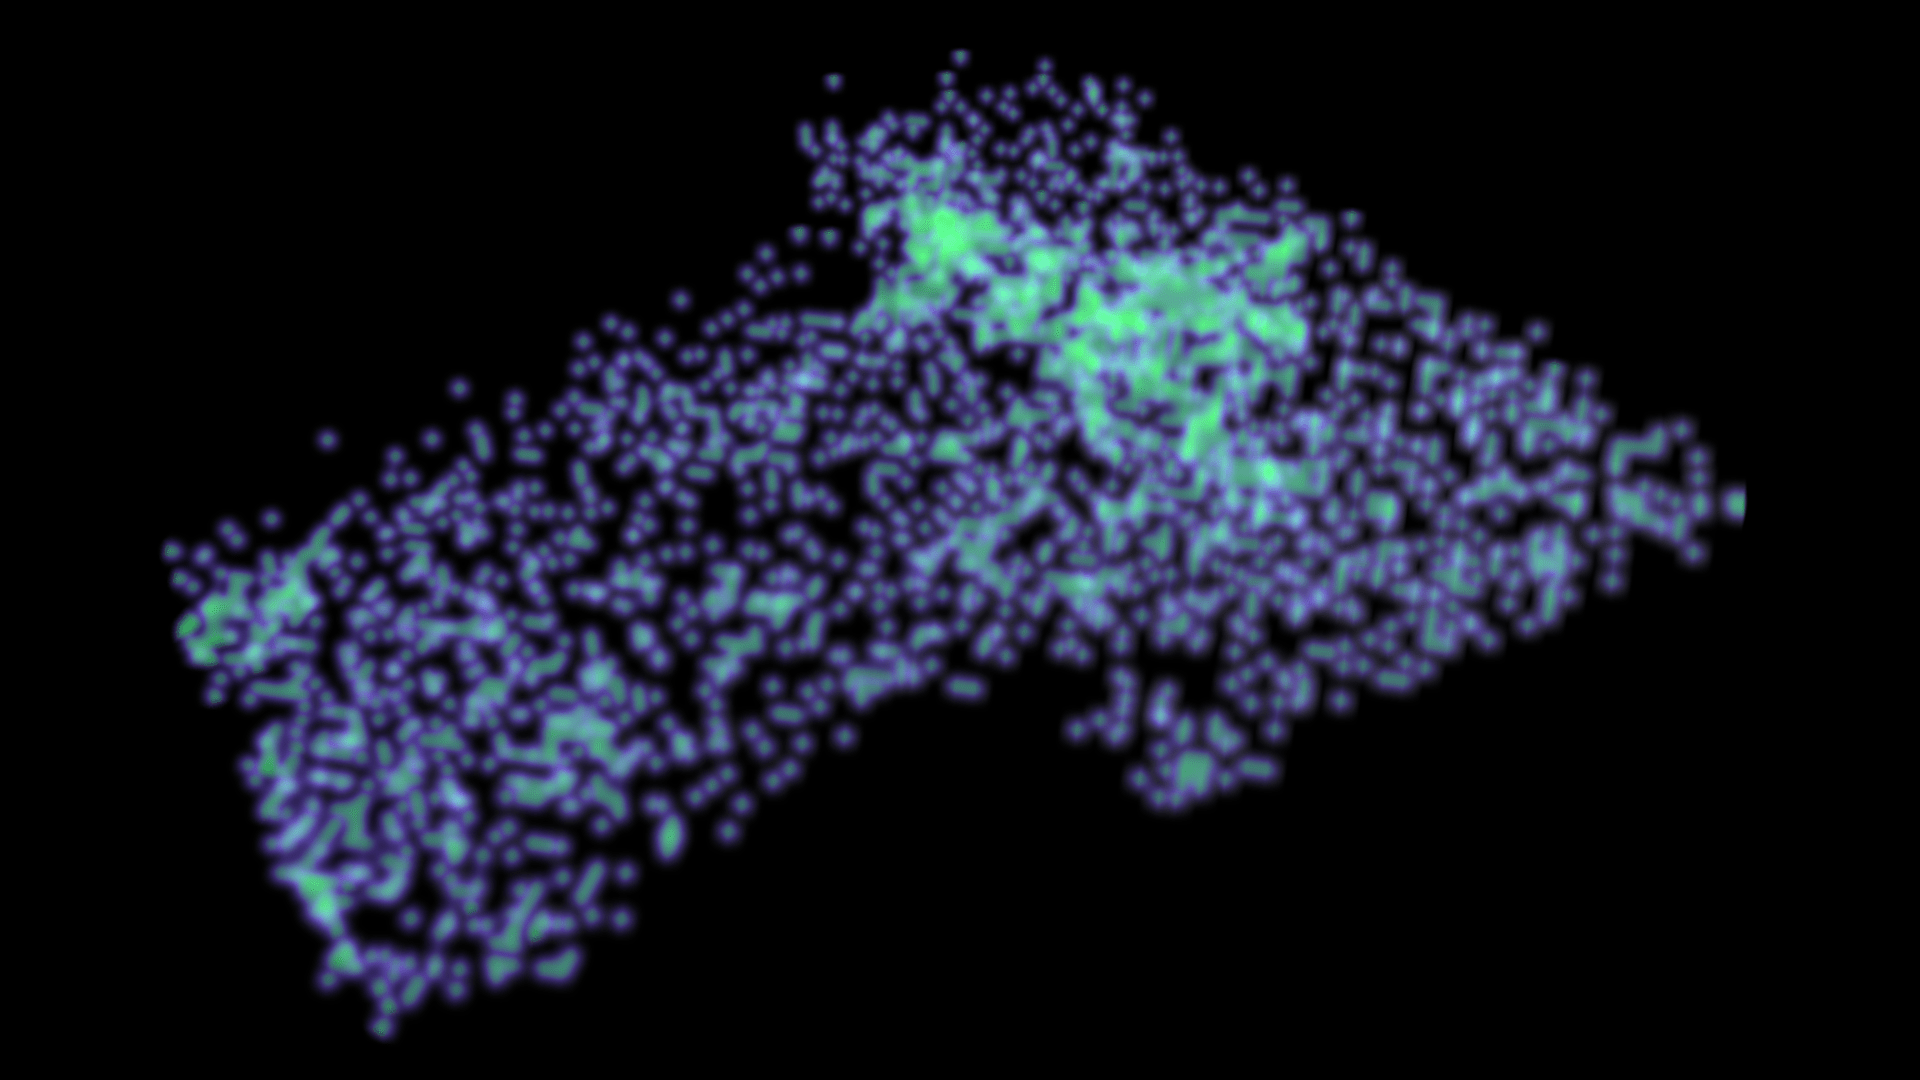
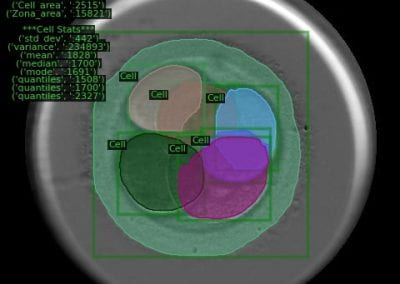
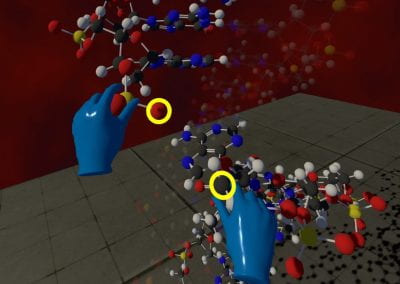
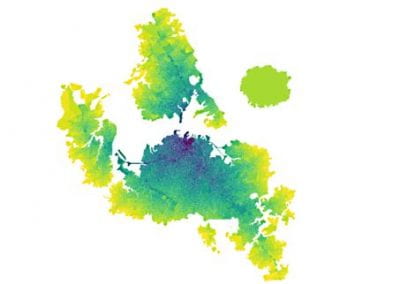
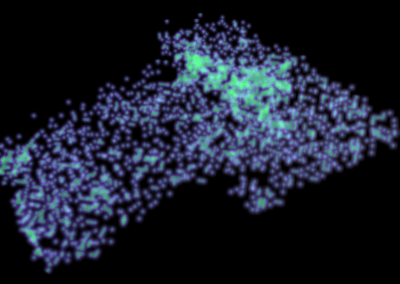
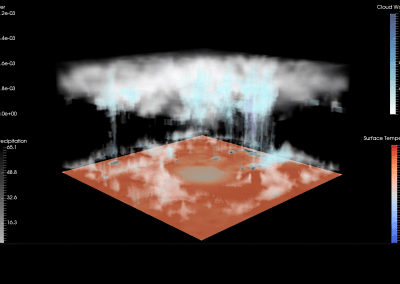
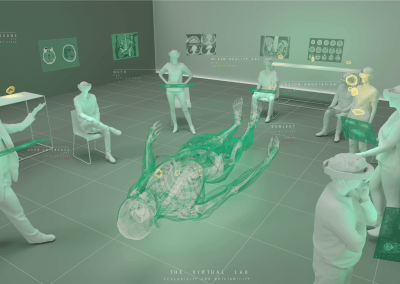
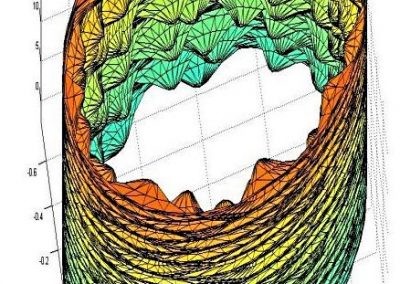
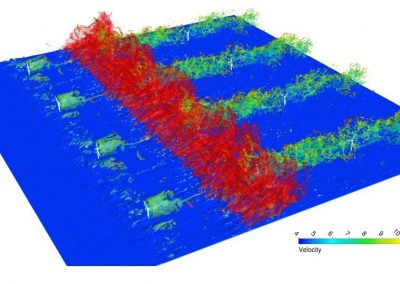
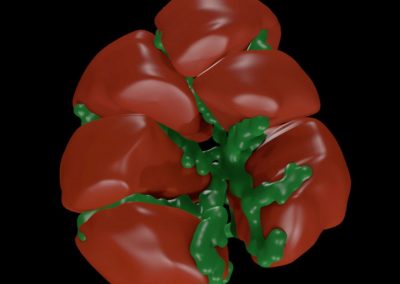
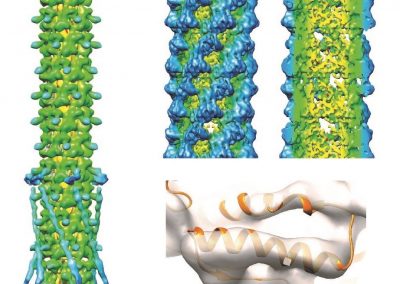
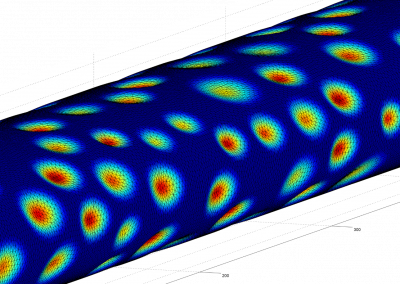
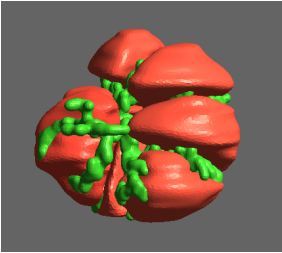
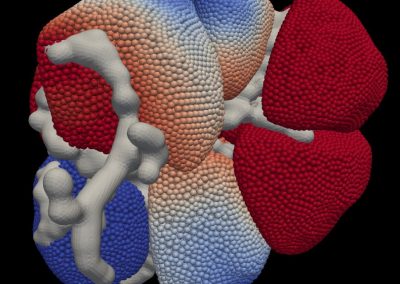
We developed an alternative approach which utilizes the computer-aided design program Blender with the Blender GIS add-on, and a custom 3D density add-on to conduct density analyses. The 3D density add-on works in conjunction with kernel based density estimation methods in the SciPy scientific computing package as well as GRASS GIS, an open source geospatial processing framework. The density add-on automates the import and density calculation process as well as the generation of 3D objects and components needed to visualise a semi-transparent data volume. The add-on allows filtering of data to view distributions of specific artefact types as well as settings to customise the grid resolution used for density statistics and coordinate-reference system used to register point positions.
An associated command line tool and Python library enables custom workflows for exporting the point densities into other formats such as image stacks and X3D compatible scenes for interactive web publication. The use of a library also provides researchers with the ability to reuse the developed components in novel ways that suit their particular analysis needs.
Application
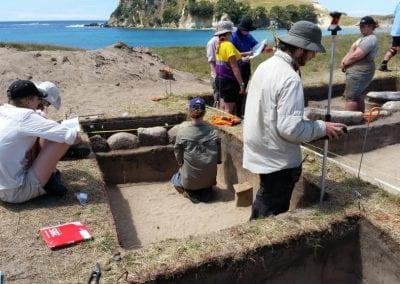
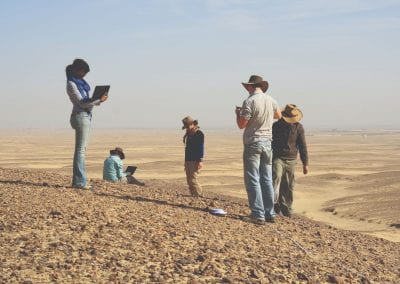
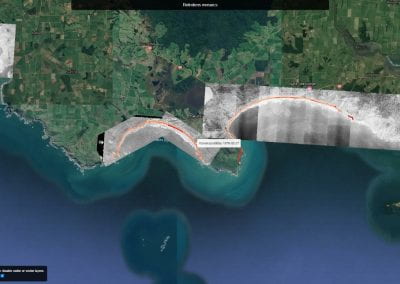
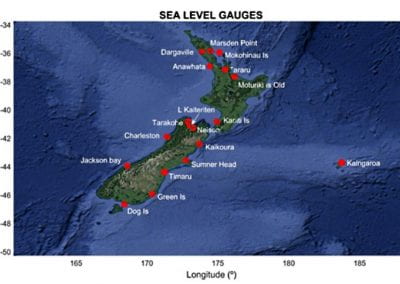
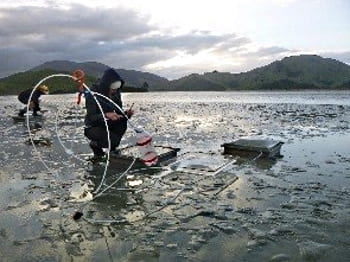
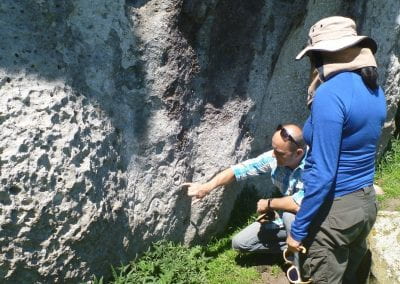
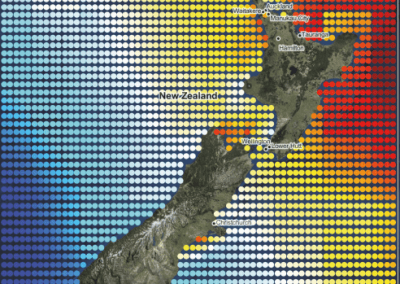
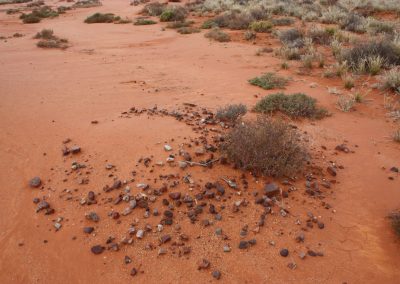
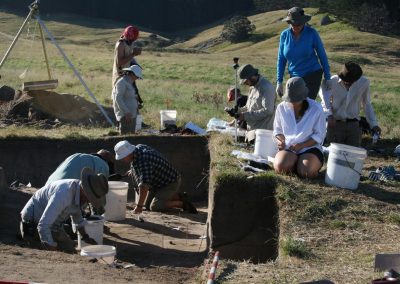
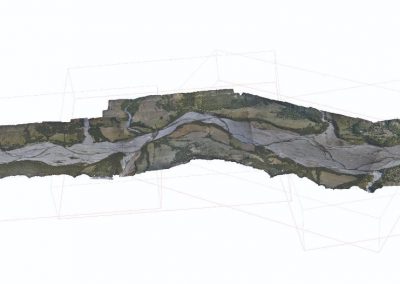
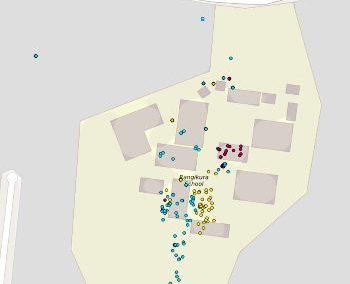
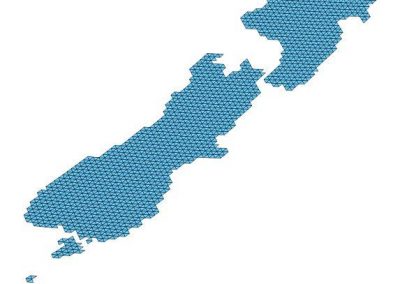
We applied these methods to a case study from Waitapu, Ahuahu, New Zealand, an artefact rich site in a beach sand matrix. The number of artefacts from excavations at Waitapu provides the opportunity to consider how the 3D distribution of objects may be used to construct an alternative to grouping artefacts rather than conventional stratigraphic layers. These groupings have provided a new way of investigating artefact deposition and their relationship to other archaeological phenomena.
Through the use of this method we aim to remove the subjectivity around stratigraphic interpretation and construct a method that is reproducible in future research. The approach may be applied in any context with sufficient artefact recording, that is artefacts with x, y, and z data. The necessary scripts and add-ons will be published open source so that they may be further developed and can contribute to developments in 3D GIS.