
Bayesian additive regression trees vs logistic regression – estimation of propensity scores
Samuel Passmore, Department of Statistics
Accurate comparison of hospital performance is crucial to the allocation of funding in New Zealand hospitals.
A problem for such comparisons is that patients and conditions are not randomly spread across hospitals. A range of factors, such as the economic environment surrounding the hospital, or a specialty unit within the hospital, mean that there may be disproportionate groups of demographics within any one hospital. When comparing hospitals’ performance, the non-random spread of patients can be accounted for through the use of propensity scores. Propensity scores weigh the importance of patients so that the demographics are balanced between hospitals. A number of methods can be used to estimate propensity scores.
My Honours project research compared the performance of Bayesian additive regression trees (BART) to a logistic regression. BART is a sum of trees model where the growth of a tree is constrained by its priors, then using an iterative Markov-chain Monte-Carlo algorithm, back fits the model for optimal fit. This method is computationally expensive.
Analysing propensity scores
Pan allowed me to run my analyses across 15 hospitals, with a sweep of parameter settings, in parallel. Considering a single run of a BART model would take between 10 –16 hours, being able to run this in parallel saved me weeks in time and allowed me to focus on the results of the analyses rather than waiting for the calculation to complete. For a project that only had a year time-frame this was very helpful. The staff at the Centre for eResearch were very helpful in helping me set up the analyses to run in the most efficient way which saved a lot of time and effort.

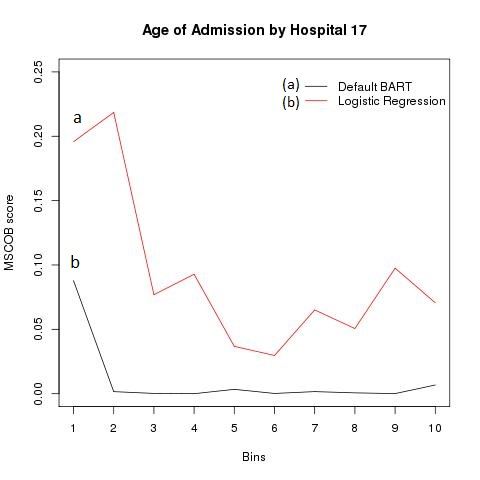
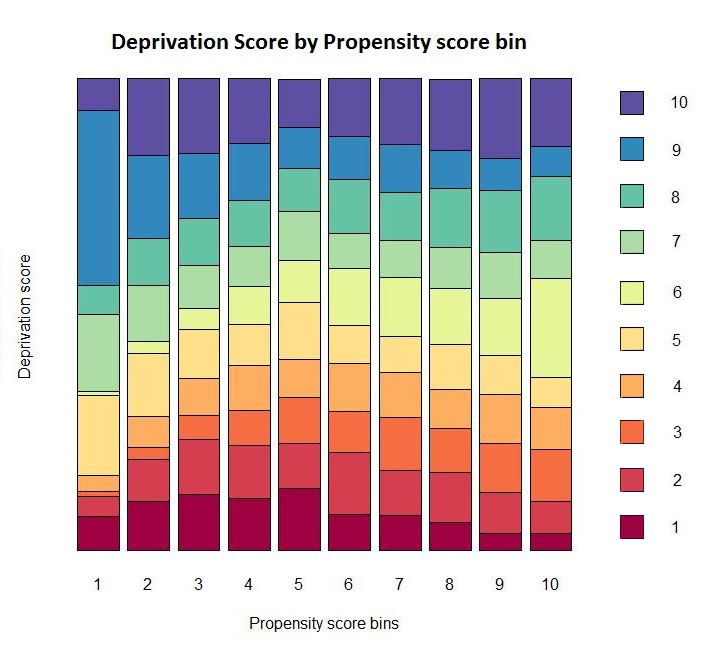
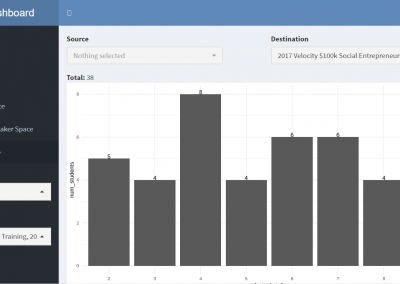
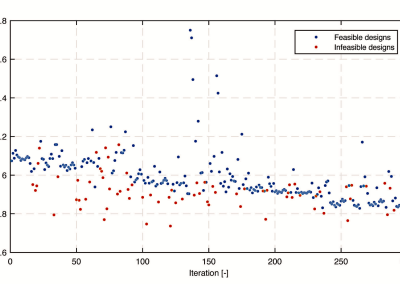
Figure 1: shows for hospital 17 the Mean Squared Covariate Balance score (MSCOB) for both the Default BART and Logistic regression models across the 10 propensity score bins. Propensity scores are continuous values from 0 – 1; however, to compare between hospitals we computed the mean-squared difference for each decile calling each a bin.

Figure 2: shows the MSCOB for deprivation score across the deciled bins. Deprivation score is a poverty scale ranging from 1, most impoverished, to 10, least impoverished. A perfect balance would show a matrix of squares. We can see from this graph that the balance is not perfect particularly in the first bin with a deprivation score of 9. This indicates there are a disproportionate number of wealthy people who have a 0 – 10% chance of attending this hospital.
See more case study projects

Our Voices: using innovative techniques to collect, analyse and amplify the lived experiences of young people in Aotearoa

Painting the brain: multiplexed tissue labelling of human brain tissue to facilitate discoveries in neuroanatomy

Detecting anomalous matches in professional sports: a novel approach using advanced anomaly detection techniques

Benefits of linking routine medical records to the GUiNZ longitudinal birth cohort: Childhood injury predictors

Using a virtual machine-based machine learning algorithm to obtain comprehensive behavioural information in an in vivo Alzheimer’s disease model

Mapping livability: the “15-minute city” concept for car-dependent districts in Auckland, New Zealand

Travelling Heads – Measuring Reproducibility and Repeatability of Magnetic Resonance Imaging in Dementia

Novel Subject-Specific Method of Visualising Group Differences from Multiple DTI Metrics without Averaging

Re-assess urban spaces under COVID-19 impact: sensing Auckland social ‘hotspots’ with mobile location data

Aotearoa New Zealand’s changing coastline – Resilience to Nature’s Challenges (National Science Challenge)

Proteins under a computational microscope: designing in-silico strategies to understand and develop molecular functionalities in Life Sciences and Engineering

Coastal image classification and nalysis based on convolutional neural betworks and pattern recognition

Determinants of translation efficiency in the evolutionarily-divergent protist Trichomonas vaginalis

Measuring impact of entrepreneurship activities on students’ mindset, capabilities and entrepreneurial intentions

Using Zebra Finch data and deep learning classification to identify individual bird calls from audio recordings

Automated measurement of intracranial cerebrospinal fluid volume and outcome after endovascular thrombectomy for ischemic stroke

Using simple models to explore complex dynamics: A case study of macomona liliana (wedge-shell) and nutrient variations

Fully coupled thermo-hydro-mechanical modelling of permeability enhancement by the finite element method

Modelling dual reflux pressure swing adsorption (DR-PSA) units for gas separation in natural gas processing

Molecular phylogenetics uses genetic data to reconstruct the evolutionary history of individuals, populations or species

Wandering around the molecular landscape: embracing virtual reality as a research showcasing outreach and teaching tool
