Calibrating gravitational wave signal parameters of Extreme Mass Ratio Inspirals (EMRIs)
Dr. Jeong Eun Lee, Prof. Renate Mayer, Dr. Matthew Edwards – Department of Statistics, University of Auckland; Dr. Ollie Burke – Max Planck Institute for Gravitational Physics; Dr. Patricio Maturana-Russel – Department of Mathematical Sciences, Auckland University of Technology; Dr. Alvin Chua – Jet Propulsion Laboratory, California Institute of Technology

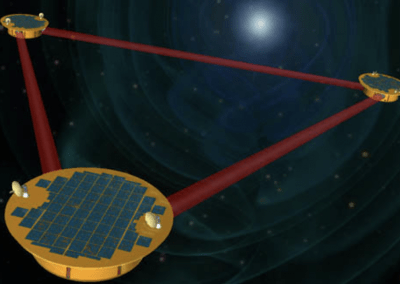
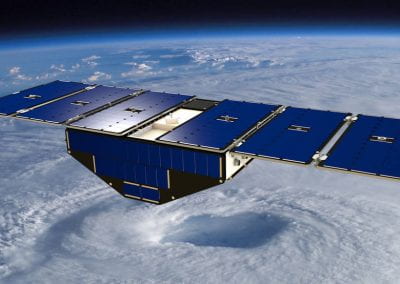
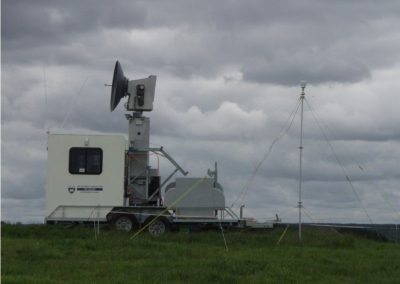
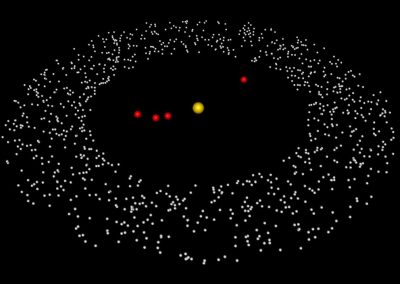
Figure 1. LISA will consist of three spacecraft, 2.5 million km apart at the corners of an equilateral triangle [Credit: ESA]
Laser Interferometer Space Antenna (LISA)
Gravitational waves, ripples in spacetime caused by accelerating massive objects, were predicted by Einstein’s general relativity theory in 1916. However, it would take another century to develop the technology to directly measure gravitational waves and open a new window to the Universe. Since the ground-breaking discovery of gravitational waves from the merger of two stellar-mass black hole binaries by the two LIGO observatories on September 14, 2015, ninety black hole and neutron star mergers have been observed by the LIGO-Virgo collaboration of ground-based detectors.
Terrestrial detectors with 3-4 km long arms operate in the high frequency range of 20 Hz to 2 kHz and are affected by low-frequency seismic noise on Earth. Therefore, the range below one Hertz where the heaviest and most diverse objects such as supermassive black holes at the centres of galaxies are expected, will not be accessible from the ground. Opening this low-frequency (10^5 to 1 Hz) window is the objective of the space mission LISA which is led by the European Space Agency with support from NASA. The LISA Pathfinder mission, completed in 2017, successfully tested key technologies and demonstrated that a space-based gravitational wave detector is feasible. LISA is planned to launch in 2034. Two lasers will be firing between each pair of spacecraft and the passing of a gravitational wave will be detected by measuring the phase differences using time delay interferometry.
Extreme Mass Ratio Inspirals (EMRI)
One of the most exciting sources of gravitational waves detectable by LISA is the capture and inspiral of a stellar-mass (10-100 solar mass ) compact object into a supermassive black hole (SMBH) at the nucleus of a galaxy. Gravitational waves that are emitted during the last years of the inspiral into a SMBH with a mass of 105−107 solar mass will be in the frequency range of LISA.
The orbits of EMRIs are extremely complicated with ultrarelativistic features, eccentricities, significant spins and inclinations at plunge. Their gravitational wave signals will provide a detailed map of the spacetime geometry surrounding the SMBH and allow unprecedented tests of predictions of general relativity in the strong gravity regime, thus are of enormous importance for astrophysics, cosmology and fundamental physics.
EMRI waveforms
The characterization of EMRIs is a formidable parameter estimation challenge. Due to the extreme mass ratio, EMRI waveforms are modelled using black hole perturbation theory where the background black-hole spacetime is perturbed by the gravitational field of the compact object, resulting effectively in a self-force that alters the motion of the object [1]. However, the generation of an accurate fully-relativistic EMRI waveform model can take from hours to days to generate. For this reason, approximate semi-relativistic waveform models have been developed that are faster to generate at the expense of accuracy [2].

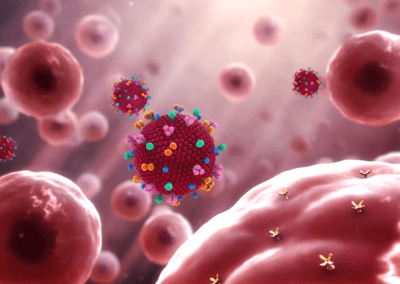
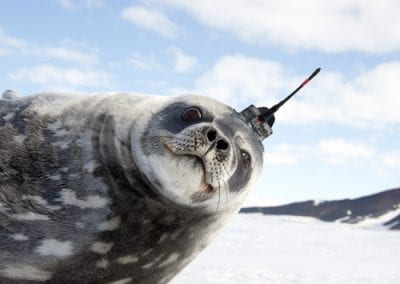
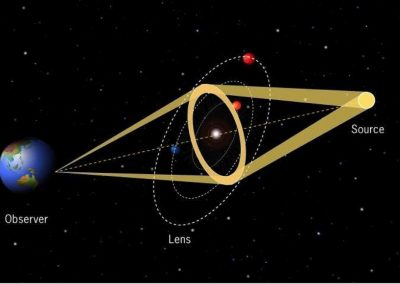
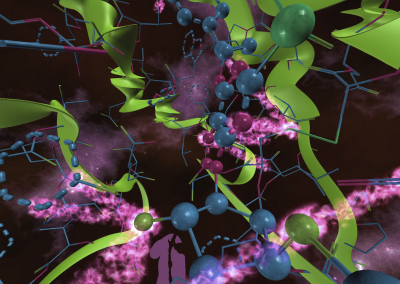
Figure 3. A smaller black hole orbits around a supermassive blackhole [Credit: NASA]

Bayesian parameter estimation
The EMRI waveform models depend on several unknown parameters such as the mass and angular momentum of the SMBH, the mass of the compact object, the eccentricity and the inclination angle of the orbit, the luminosity distance and the sky location of the system.
Starting with a prior distribution of the unknown parameters, the Bayesian approach updates the prior distribution to the posterior distribution by taking the likelihood function of the observations into account. Markov chain Monte Carlo (MCMC) methods are used to generate simulated values from the posterior that are then used to provide estimates of the parameters and of their uncertainties in the form of posterior credible intervals. However, MCMC usually requires a large number of iterations and a new waveform generation in each likelihood evaluation. Only approximate EMRI waveform models such as the AAK [2] are fast enough for this purpose but will yield samples from an approximate posterior. The resulting Bayesian credible intervals with a nominal level, say 95%, will be approximate credible intervals and in general not achieve their nominal coverage of 95%. Consequently, it is important to estimate their operational coverage, i.e. the posterior coverage of the EMRI parameters if the data had been generated from the exact waveform model. In this way, one can quantify the approximation error and enable a subsequent adjustment of nominal coverage levels to provide more accurate error estimates.
Calibration of posterior credible intervals
The operational coverage probability could be estimated by sampling from the exact posterior and taking the proportion of the samples that fall inside the approximate credible interval. However, this is impractical because sampling from the exact posterior takes too long or the exact likelihood is intractable. Instead, an estimate based on probit regression was proposed by [3] that requires only sampling from the exact likelihood and the prior. It uses a Bayesian additive regression tree [4] to nonparametrically estimate the regression function. In a preliminary demonstration of this approach, we calibrate approximate credible intervals obtained using the fast but less accurate AAK against the NK which serves as the “exact” waveform.
Initial results using the Nectar Research Cloud
This cross-disciplinary project requires collaboration between statisticians and astrophysicists, in particular accessing and working on the same data and code. After getting advice from the team at the Centre for eResearch of the University of Auckland, we applied for access to the Nectar Research Cloud and were allocated an initial 4 virtual CPUs with 16 GB RAM. This enabled joint access by all collaborators from the University of Auckland, the Jet Propulsion Lab at Caltech and the Max-Planck-Institute for Gravitational Wave Physics in Potsdam, Germany.
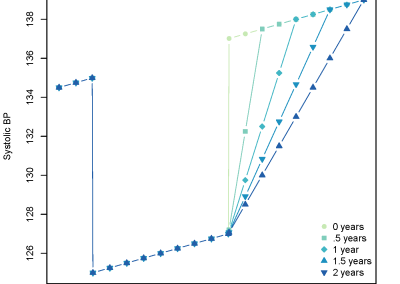
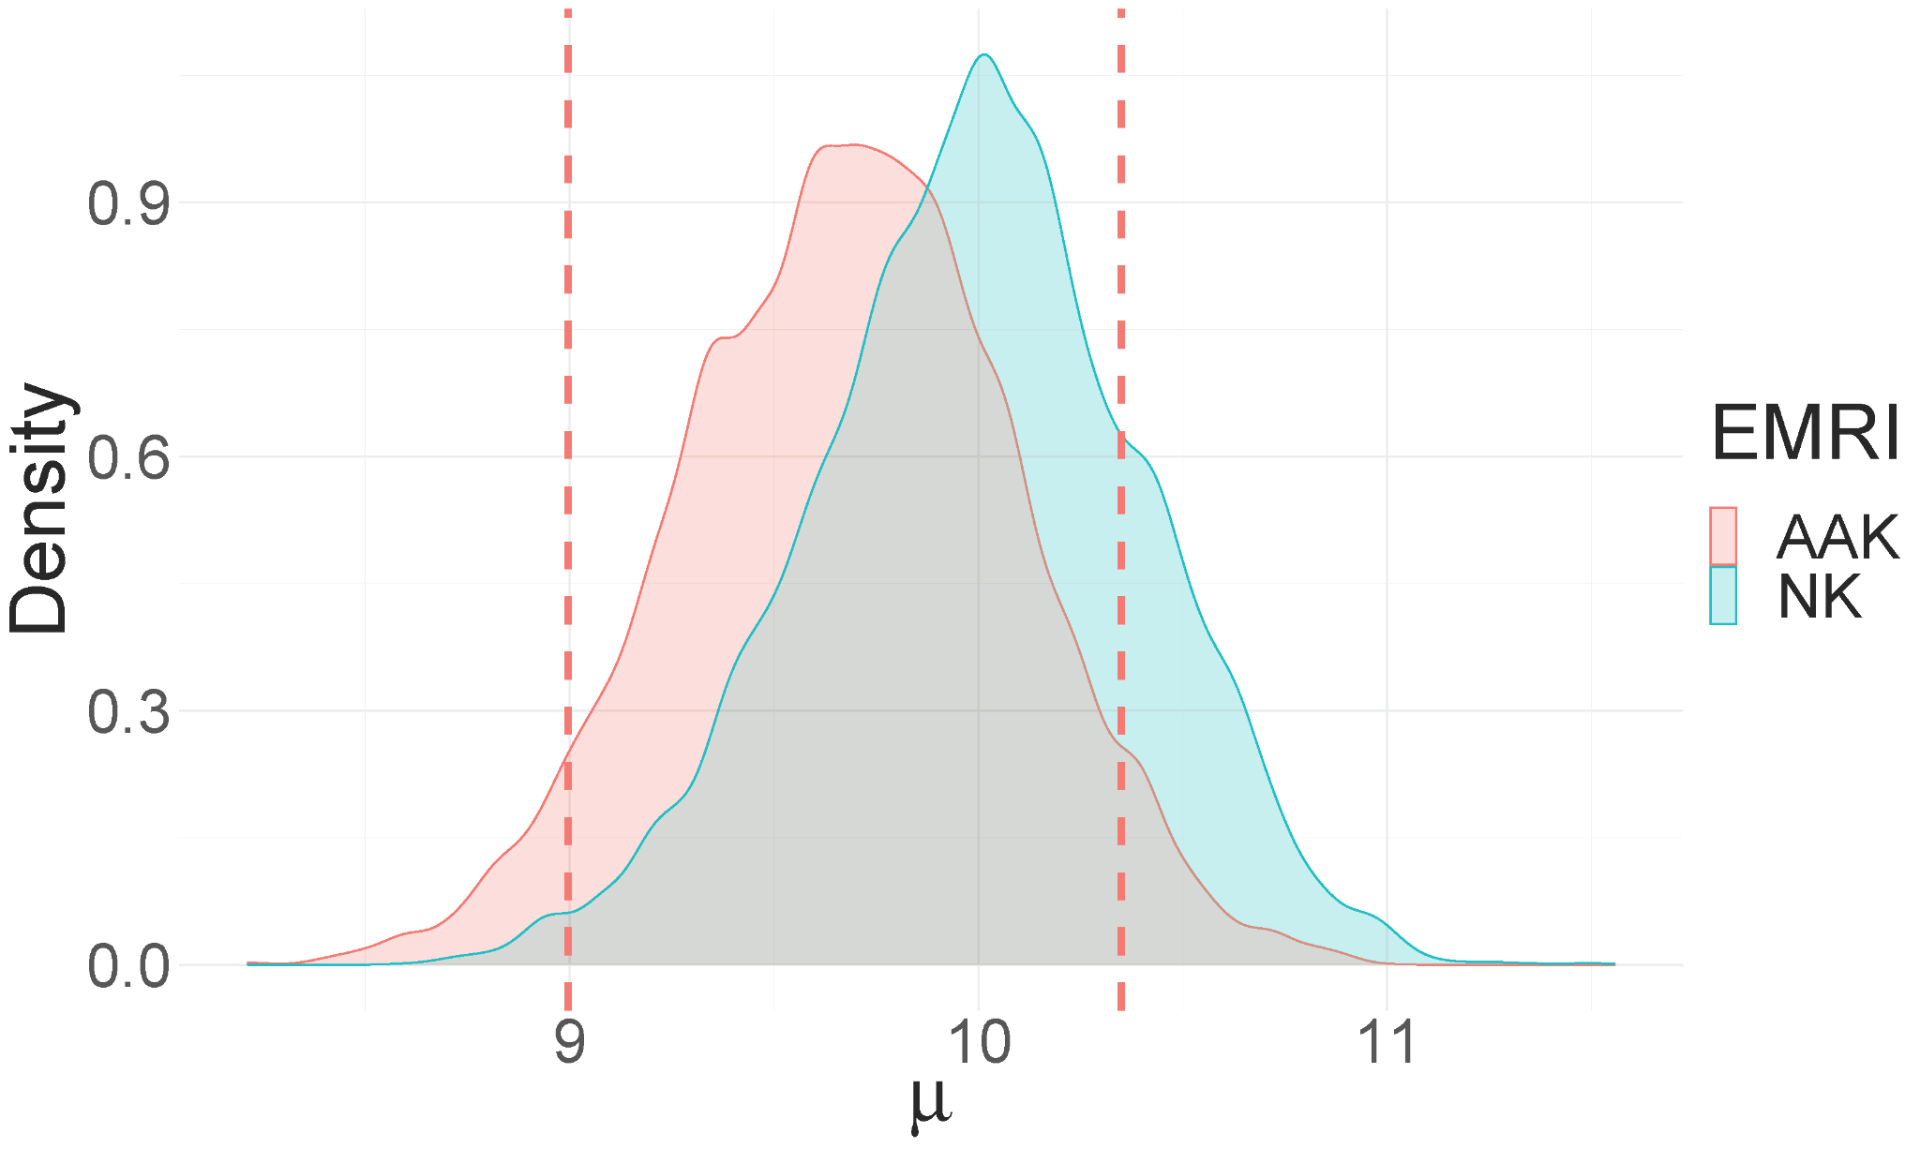
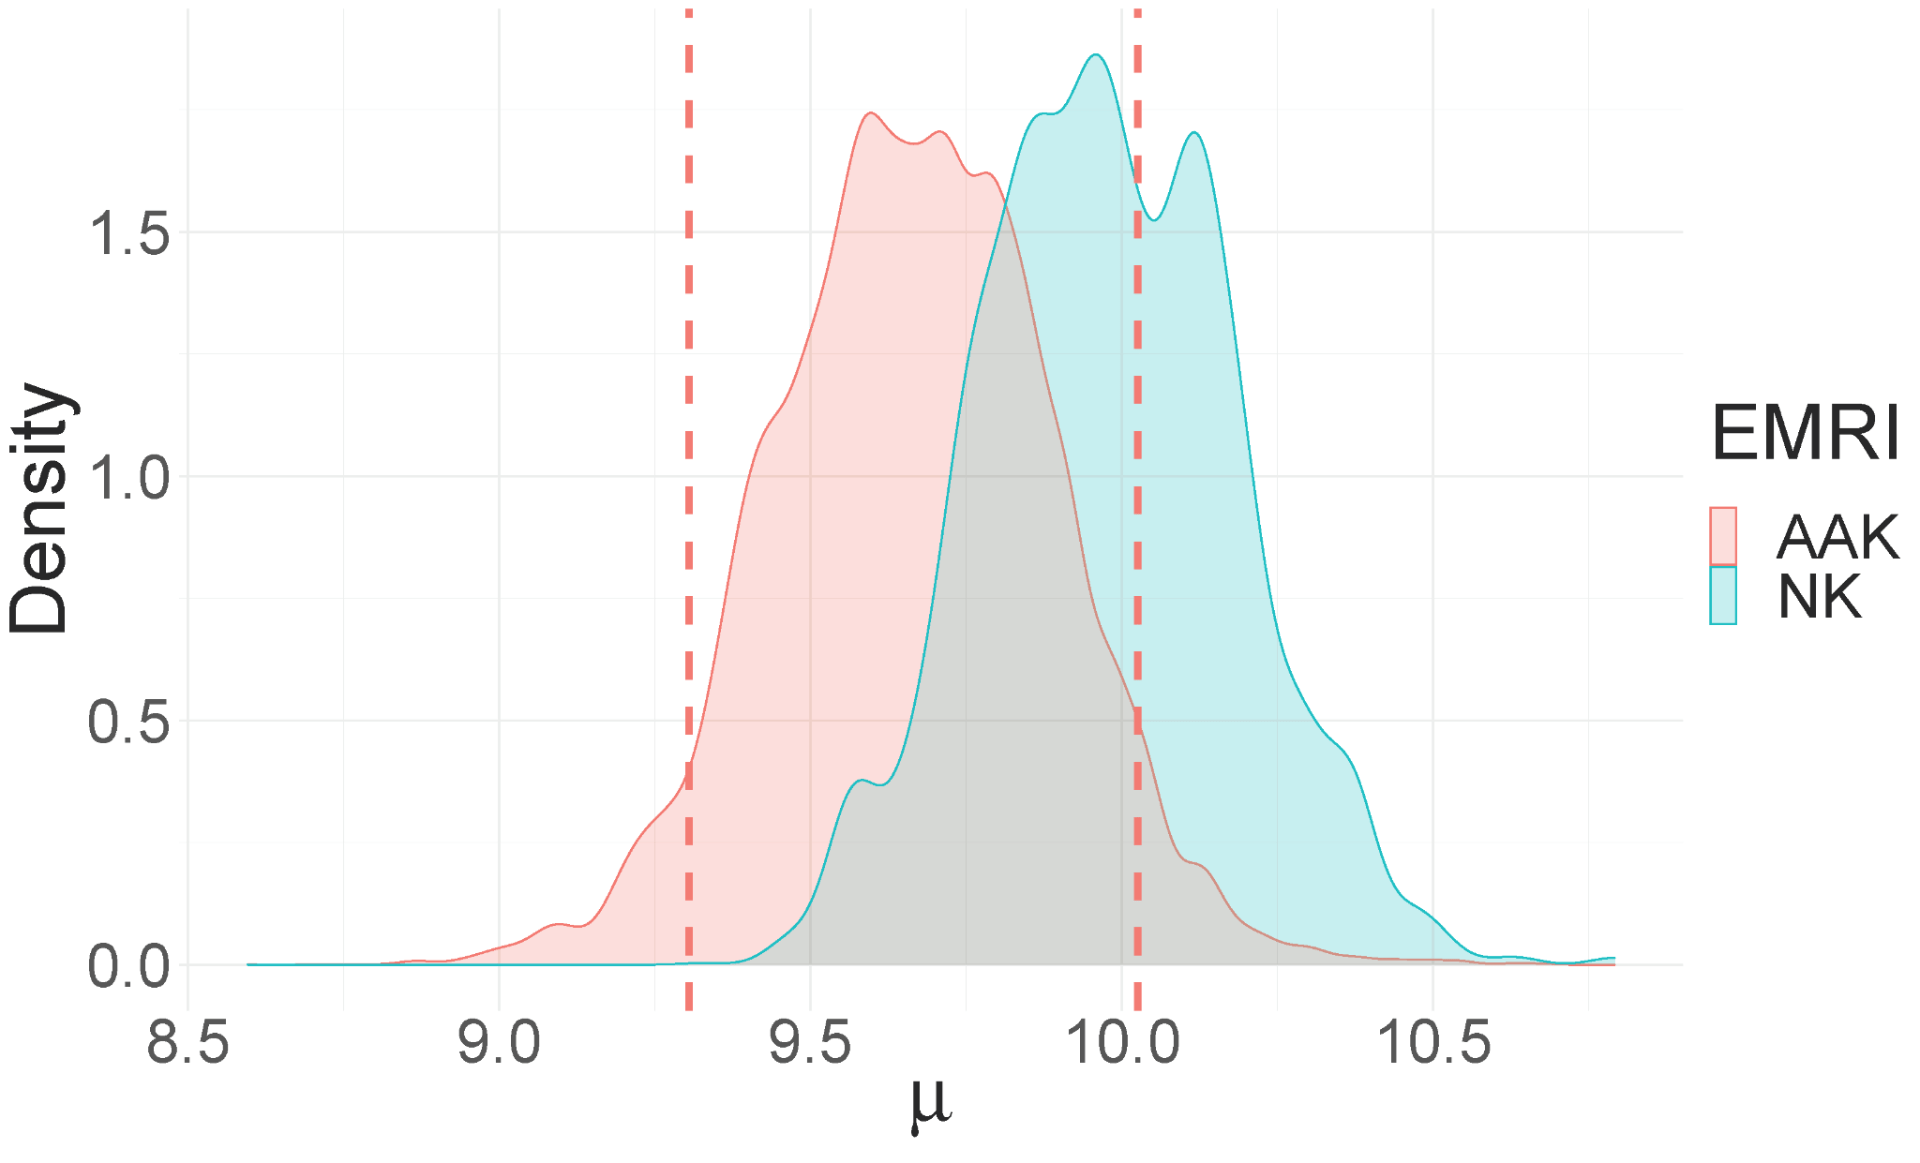
We used one day of simulated observations sampled at 0.1 Hz of an NK waveform embedded in LISA noise with primary and secondary mass of M = 106 solar mass and μ = 10 solar mass , respectively. As an initial demonstration, the aim was to estimate μ starting with a uniform prior distribution on 8-12 solar mass while treating all other waveform parameters as known. We varied the source distance D = 0.1, 0.2, 0.3 Gpc (corresponding to a signal-to-noise ratio of 30, 15 and 10, respectively) to study how the operational coverage varies with distance. We obtained the following estimates of the operational coverage in comparison to the exact operational coverage in the table 1 and figure 4. With decreasing distance, i.e. increasing SNR, the posteriors become narrower and systematic errors are amplified.
Outlook
The waveform models used in our initial study already have native GPU implementations, and we hope to leverage this in follow-up analyses. Doing so would accelerate the generation of data sets and the training of regression models, as well as facilitate an extension of our study to longer signals, more parameters, and larger regions in parameter space.
| D (in Gpc) | SNR | c(Yo) | c_mean(Yo) |
| 0.1 | 29.53 | 0.593 | 0.608 ± 0.192 |
| 0.2 | 14.76 | 0.866 | 0.937 ± 0.113 |
| 0.3 | 9.84 | 0.959 | 0.953 ± 0.114 |
Table 1. Exact and estimated operational coverage estimates of the AAK posterior as source distance changes.
 |
 |
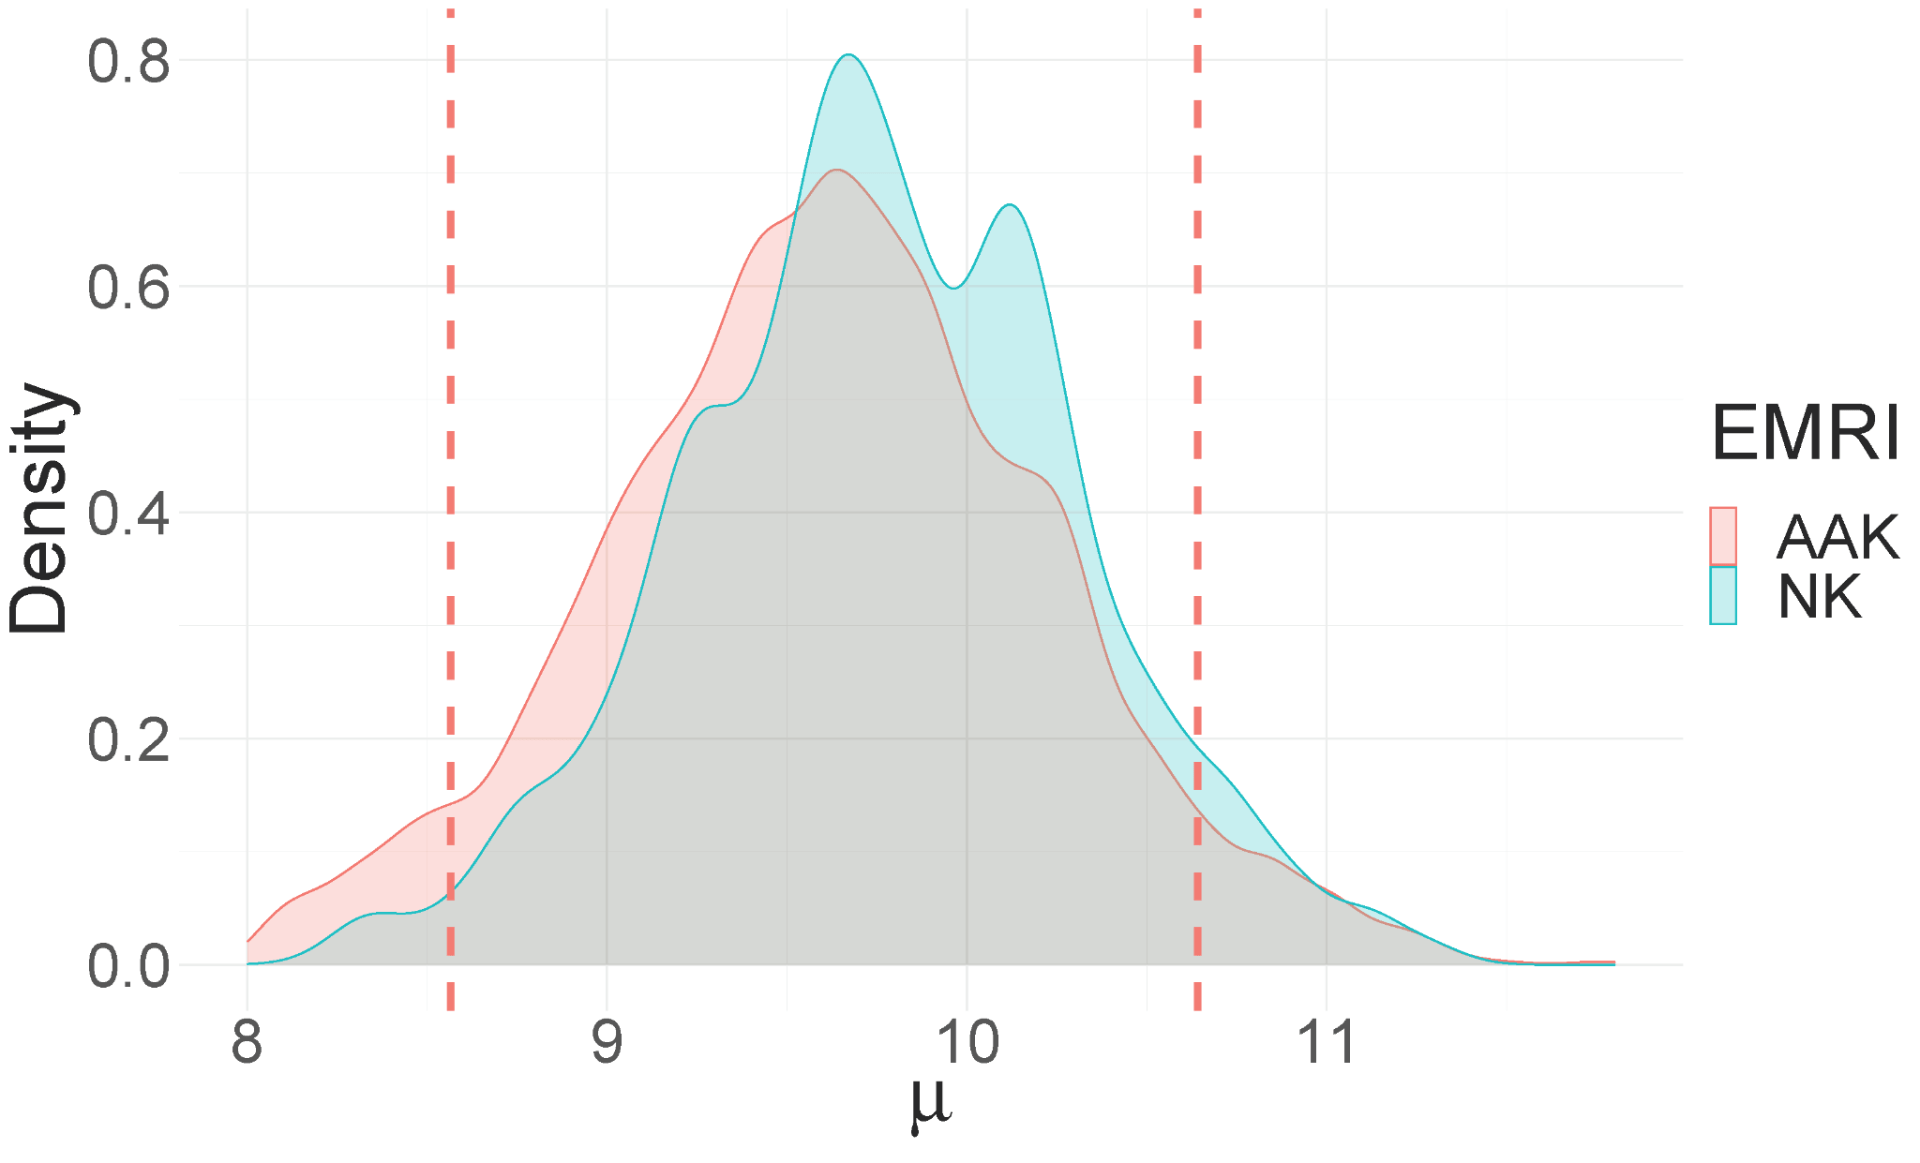 |
Figure 4. Kernel density estimate of μ using the NK and AAK waveforms. Left panel: D = 0.1. Middle panel: D = 0.2. Right panel: D = 0.3
References
[1] Barack, Leor and Cutler, Curt 2004, Physical review. D., Volume 69, 8
[2] Chua, Alvin J.K., Moore, Christopher J., Gair, Jonathan R. 2017, Phys. Rev. D., Volume 96, 4
[3] Jeong Eun Lee, Geoff K. Nicholls, and Robin J. Ryder 2019, Bayesian Analysis, Volume 14, 4, 1245-1269
[4] Chipman, H.A., George, E. I., and McCulloch, R. E. 2010, The Annals of Applied Statistics, Volume 4, 4 266-298