COVID-19 exponential growth visualisation
Nick Young, Prof Mark Gahegan, Centre for eResearch; Dr Graeme Lindsay, Prof Alistair Woodward, School of Population Health, University of Auckland.
David Suzuki – the renowned Canadian scientist, broadcaster, author, activist and co-founder of the David Suzuki Foundation – gives the following example when thinking about the concept of growth

Imagine a test tube with one bacteria in it at the start. Exponential growth starts and the number of bacteria double every minute. At one minute, there are two bacteria. Two minutes, four. Three minutes, eight. Four minutes, 16 bacteria and so on. At one hour, the test tube is full. He then asks…When is the test tube half full? The answer is at the 59th minute. At 58 minutes it’s 1/4 full, at 57 minutes it’s 1/8 full.
This idea of steady doubling is exponential growth and it is an important concept to understand in many areas such as population growth, resource use and sustainability. David, in fact, is using the test tube example as an analogy for the human population, resource use and unsustainable growth on Planet Earth (the ‘test tube’). Instead of bacteria in a test tube, we now have SARS-CoV-2. Exponential growth is also important to identify and understand when dealing with infectious disease outbreaks and their control.
For this case study, the aim was to visualise trajectories of the COVID epidemic, including both global trends and New Zealand data. We started by exploring Covid-Trends – a pre-existing interactive web-based dashboard that shows the trajectory of COVID-19 cases around the world. Data are visualised for each country as well as for Canadian, Australian and US states. The tool was originally created by Aatish Bhatia in collaboration with Minute Physics and the code is in the public domain. The original Covid-Trends code was adapted by CeR’s Nick Young to also show New Zealand Ministry of Health COVID-19 data. Data can be filtered by case definition, averaging period, travel history, age and location (such as DHB) in New Zealand. To support this tool, Nick Young also wrote a Python script to check the MoH website for new cases every 10 minutes, so that the data is always up to date. Adaptation of the tool was supported by the School of Population Health. For detailed exploration of the Covid-Trends version with New Zealand data, visit https://uoa-eresearch.github.io/covidtrends/. It is important to note that Covid-Trends focuses on epidemic trajectories, rather than absolute numbers of COVID-19 cases or population rates. The aim is to pick up changes on a day-to-day or weekly basis. In this way the tool provides a fine-grained visualisation of a particular country or region’s COVID journey e.g. are they in a phase of exponential growth?…in which case appropriate control measures need to be implemented.
Detecting when exponential growth stops is also important as it gives clues that an outbreak may be starting to be brought under control. The Covid-Trends default graph is the growth rate of new cases in the past week versus total cases to date. Cases are graphed using logarithmic scales as this enables exponential growth to be seen as a straight line that slopes upwards. The log scale also enables easier comparison between countries with very different cases numbers as they can all be seen on the same graph. Note: a user can also change to a linear scale. Despite many differences in diagnosis and reporting of COVID cases, almost all countries have followed the same growth path early in the outbreak. As would be expected with an infectious agent entering an immunologically naive population with no public health controls in place, the number of cases grows exponentially. The doubling time (2 days) appears to be much the same in this phase nearly everywhere, suggesting it is features of the virus rather than environmental conditions that mostly drive spread early on. When public health interventions are introduced, or transmission of the virus is limited for other reasons, countries ‘fall off’ the straight line of exponential growth.
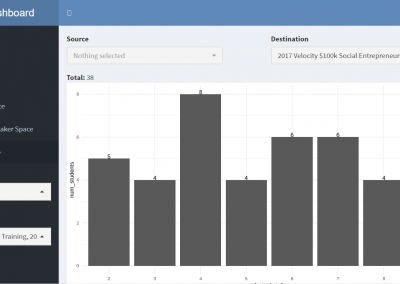
See Figure 1 for an example from Covid-Trends of the paths taken by selected countries. In some cases, countries (eg the UK and the US) have, after an initial dip, experienced further waves of infection and for a time resumed exponential growth.

Fig 1. Screenshot of Covid-Trends showing the growth path for confirmed COVID cases for selected countries.

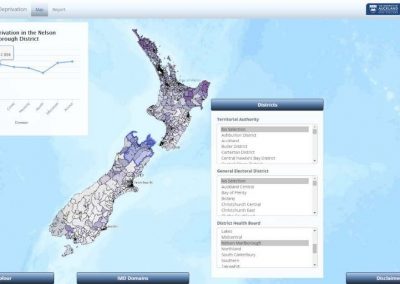
Figure 2 shows Covid-Trends displaying the trajectory of NZ COVID-19 cases using the New Zealand Ministry of Health data. Exponential growth is again displayed as a straight, upward sloping line. Like many other countries, NZ had a period of exponential growth early in the pandemic with around a 2-day doubling time in the number of cases.
For further information on the original Covid-Trends tool and the rationale for the exponential growth approach, please see the COVID trends / Minute Physics video at www.youtube.com/watch?v=54XLXg4fYsc. David Suzuki’s video on the ‘test tube’ and overpopulation is available at http://resources4rethinking.ca/en/resource/david-suzuki-speaks-about-overpopulation