Data analytics and visualisation for improving
public health and transport planning
Professor Mark Gahegan, Computer Science; Assoc Professor Daniel Exeter, Epidemiology and Biostatistics; Professor David O’Sullivan,
Victoria University of Wellington; Nick Young, Sina Masoud-Ansari, Centre for eResearch
Overview
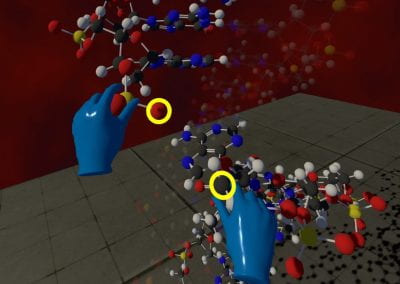
Conventional ways of collecting data such as censuses and surveys are increasingly gathered at a micro-scale individual level. The improvements of collection methods designs and data integration across various government and service agencies, coupled with analytics, visualisation, and sophisticated Deep Learning methods to support assessments, projections, interventions and innovation, can bring meaningful social outcomes. The micro-simulations and mathematical models of citizen behaviour, mobilities, decision-making, and choices support the government on economic policy, social welfare, and public safety to build healthier lifestyles and smarter cities.
The transport project aims to harness both the new data and new analysis methods to provide better insights into public transport uptake, accessibility, planning and policy that will help in improving transport services. Auckland Transport (AT) now has some very accurate microdata on public transport via HOP card, which shows the date and time of travel, the journey’s origin and destination, and the bus route. The data can be used to map with demographics, place of employment and the geography of Auckland. The resulting datasets are rich with possibilities that provide better insights into public transport uptake, accessibility, planning and policy-making.
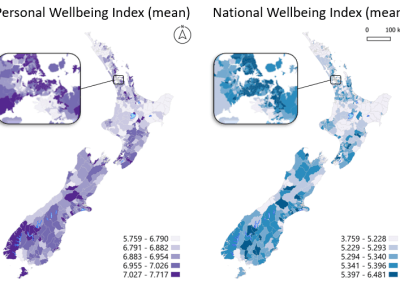
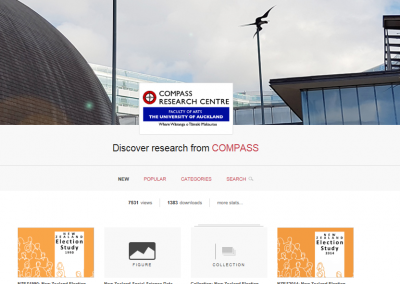
The health project is to help decision-makers to compare likely impacts and benefits on public health across the whole of New Zealand. To achieve this goal, the team worked with multiple government agencies to create an “e-Atlas” to facilitate the discovery of important trends over space and time and compare places and regions of interest at several aggregated levels. The project will create a sophisticated picture of lifestyles, deprivation, welfare and life courses, supported by best practices in data visualisation and analytical capability via collaboration between the Turing Aotearoa and Alan Turing Institute in the UK. We will look at some examples of work in the following sections.
Using visualisation to support the exploration of transport data
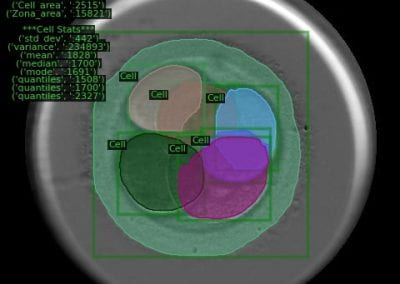
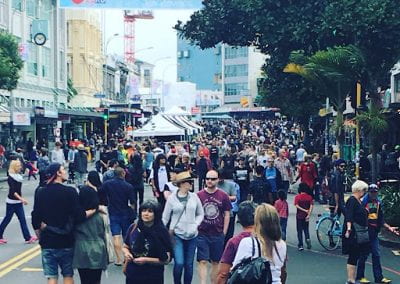
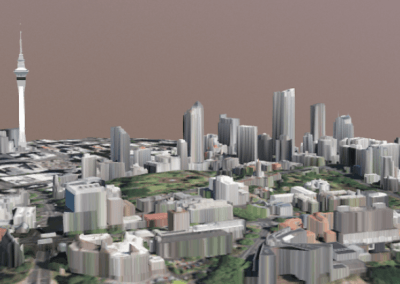
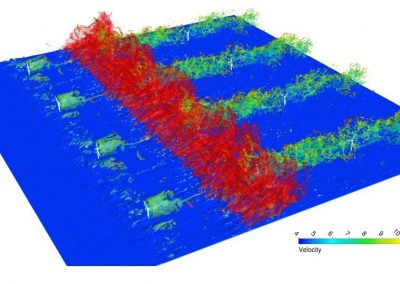
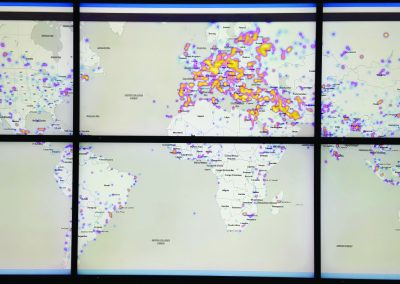
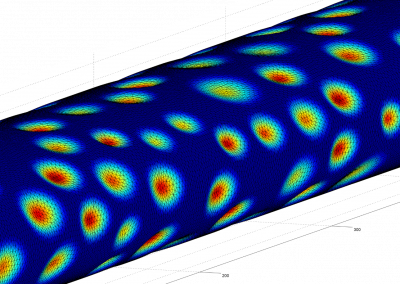
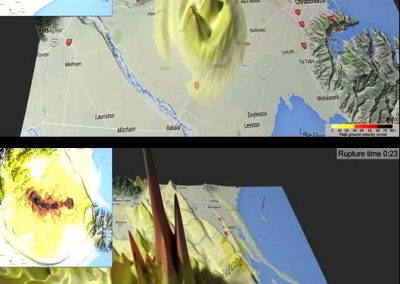
One body of work was to create a near real-time traffic visualisation map by collecting traffic camera images from the New Zealand Transport Agency (NZTA) website. (https://www.journeys.nzta.govt.nz/traffic-and-travel-information/traffic-cameras/). There were approximately >112M images collected from 297 cameras, summing to >5TB, which were run on the University of Auckland Nectar cloud with V100 GPU capacity. These images were processed with ImageAI (https://github.com/OlafenwaMoses/ImageAI) from the Python library with self-contained Deep Learning capability. The resulting code can capture and count the number of motorcycles, cars, buses and trucks present in each image. The visualisation map shows the vehicles detection and traffic flow pattern (Figure 1), which can be used, for example, to assist effective management of road traffic infrastructure and deployment of intelligent transportation systems.
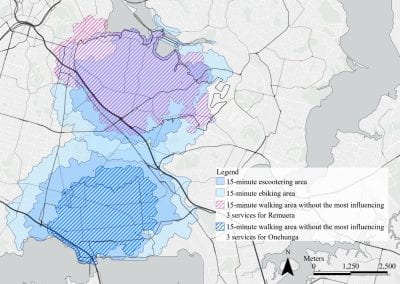
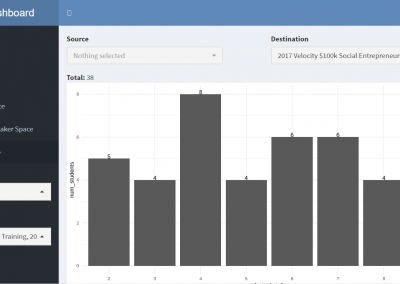
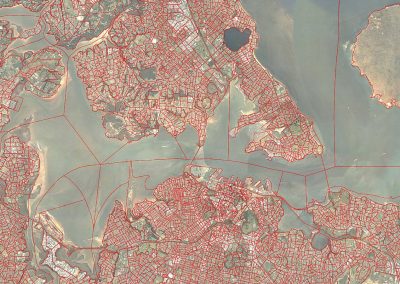
Workflow analysis to determine location-based accessibility to essential services
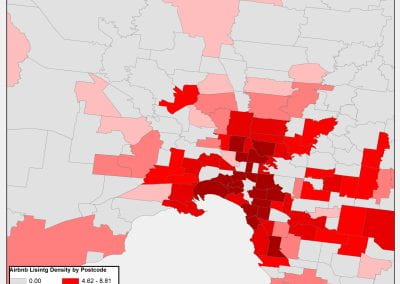
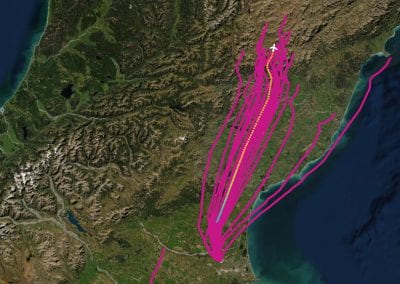
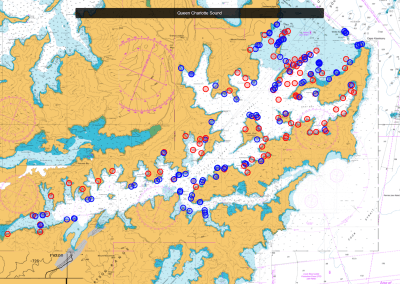
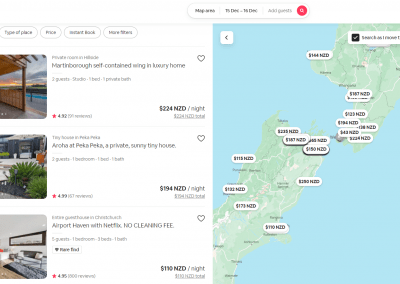
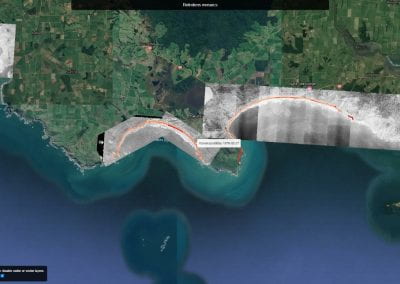
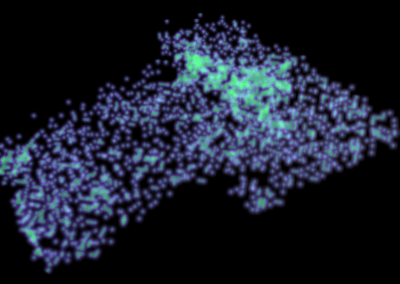
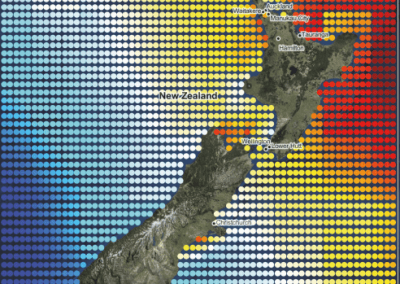
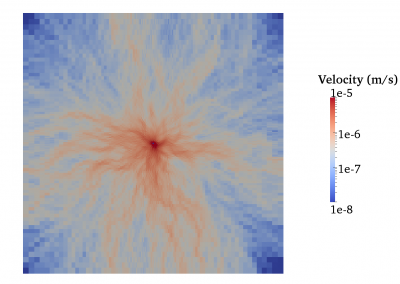
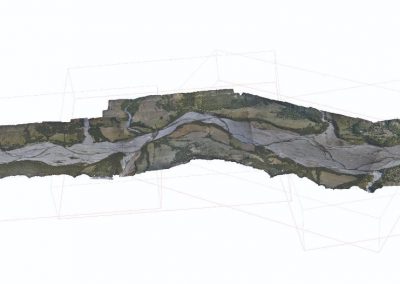
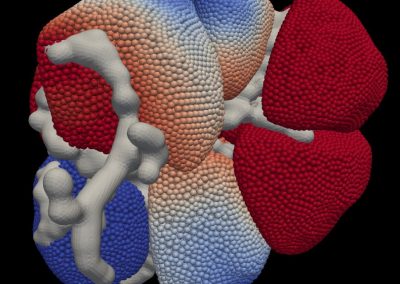
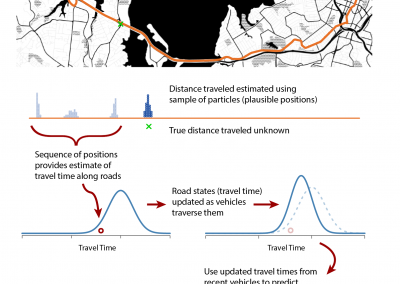
Another exploration was to look at the relationship between accessibility to essential services via public transport and how they are related to the measurement of deprivation in the New Zealand population. We used data sourced from The General Transit Feed Specification (GTFS) feeds for Auckland, Wellington and Christchurch and used OpenStreetMap (OSM) to build a walking, cycling and driving network. The New Zealand OSM data is sourced from GeoFabrik and GDAM for region boundaries, and the travel time was calculated using OpenTripPlanner. We were looking at the possibility of finding the shortest path transit travel times between sets of origins and destinations in major cities (Figure 2) such as Auckland, Wellington and Christchurch etc., and exploring how easy it is to access essential services (such as hospitals) within these major cities.


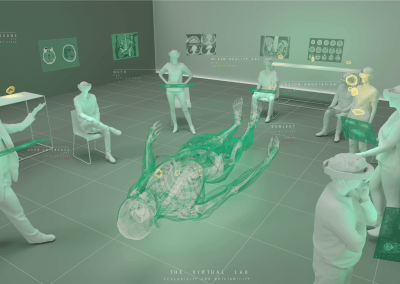
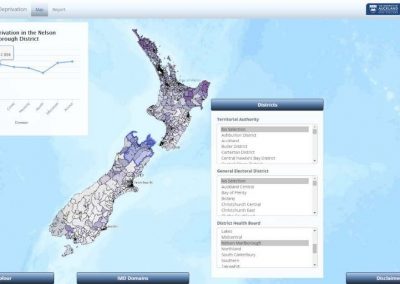
Visual analytics laboratory to improve social policy design
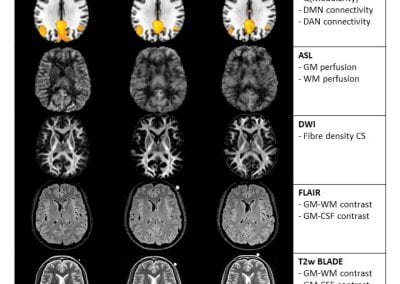
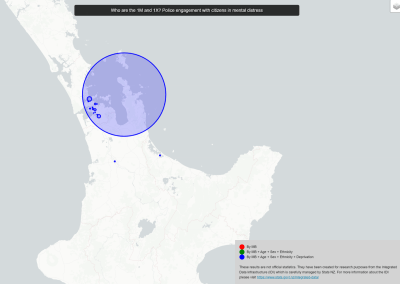
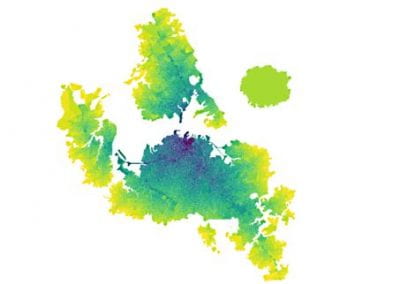
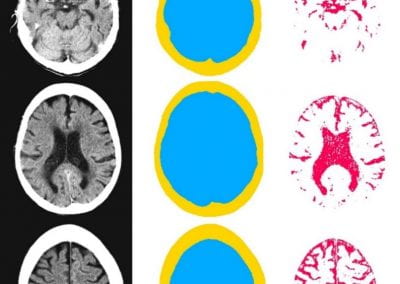
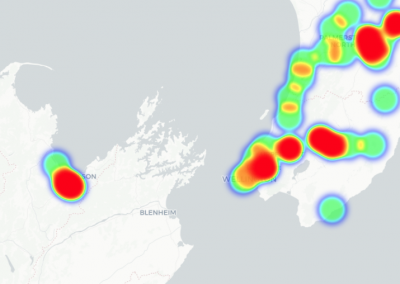
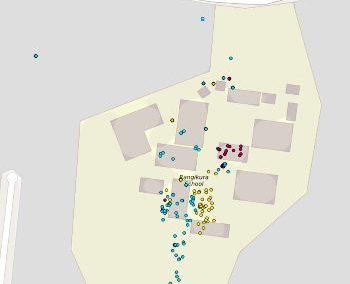
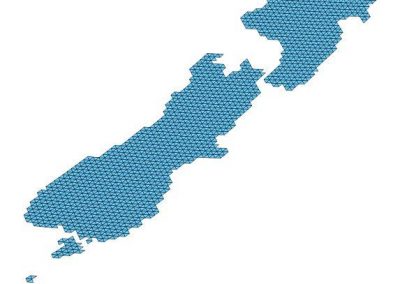
We have extracted the demographical smoking data from the 2018 NZ Census and the relevant cancer data from the Ministry of Health. These data were integrated using an open source Geographic Information System QGIS (https://www.qgis.org/en/site/), and processed with Pandas tool from Python library, further mapped with JavaScript libraries Leaflet (https://leafletjs.com/). Finally, they plotted with the Plotly tool (https://plotly.com/javascript/). We also add analytics and Deep Learning capability to help identify trends, anomalies, hotspots and other features of interest. These tools could also be used to project into the future based on observed (learned) trends. The resulting source code is open source at (http://github.com/uoa-eResearch/cancermap). (Figure 3)
Collaboration
By linking together the latest data, visual analytic methods, spatial analysis techniques, and machine learning tools to create a collaborative visual analytics laboratory for public transport is the first of its kind in New Zealand.

Figure 3. Visualisation of New Zealand cancer map
Turing Aotearoa is a direct collaboration with the Alan Turing Institute (ATI) in the UK. Both parties share ambitions and a version to deliver new training, research and data science leadership opportunities. This enduring collaboration aims to improve the data science and Al skills to support the next generation of data-intense research and recognise that data science and Al are rapidly developing disciplines drawing expertise from multiple sectors, industries and academic pathways.