Evenly spaced observation fields from irregularly sampled data in the Southern Ocean
Fabio Vieira Machado, PhD Candidate, School of Environment
Introduction
In recent decades, considerable research has been undertaken to investigate the role of the Southern Ocean – SO, in global ocean circulation and to study the changes that have been taking place in Antarctica in response to climate change. The aim of this research project is to study the mean fields of the physical properties of sea water in the SO using direct observations. For this, grid systems were designed to create uniformly spaced data fields in time and space from data irregularly sampled. Data are firstly gridded at 0.5º – and 1º, latitude and longitude, and then averaged at 10 decibars. In addition to spatial resolution, time scales are defined in order to calculate monthly, seasonal or climatological mean fields. Time and space interpolation will depend on the purpose of work and data coverage.
Data
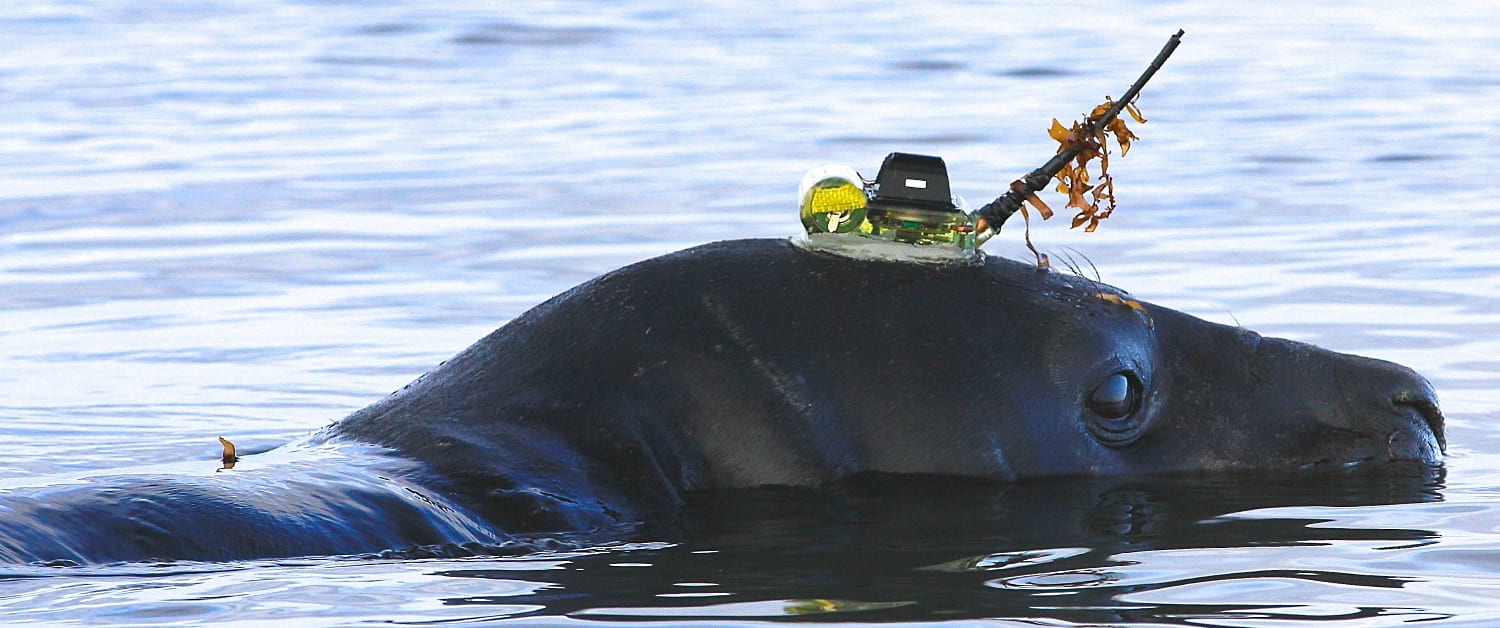
Seawater temperature and pressure data sampled by Argo floats – Roemmich and Gilson, 2009, and elephant seals – Roquet et al., 2013, to the south of 65ºS in the SO are used in this report. A total of 183,145 vertical profiles stored in NetCDF file format – Common Data Form, were downloaded: 118,767 sampled by Seals, between 2004 and 2018; 64,378 by Argo floats, between 2001 and 2019 – Table 1, . A total of 6,117 vertical profiles – 2,571 sampled by Argo floats and 3,546 by Seals, were located to the south of 75ºS and were not used in this analysis.
Methods
A total of 177,028 vertical profiles unevenly sampled in time and space in the SO were arranged in two regularly spaced grid systems (1) 0.5º latitude and longitude: used for the climatological and seasonal mean fields. In this configuration, 720 (0-719) grid points were created along the longitudinal section, between 180ºE-180ºW, and 30 (0-29) along the meridional section, between 60ºS-75ºS; (2) 1º latitude and longitude: used for the climatological and seasonal mean fields. In this arrangement, 360 (0-359) grid points were created along the longitudinal section, between 180ºE-180ºW, and 15 (0-14) along the meridional section, between 60ºS-75ºS. At this phase, the code written in Python reads the geographic coordinates of each vertical profile and repositions these profiles to the corresponding grid cells. Data can be analysed by type of platform (Argo and Seal), and also combined together (Argo+Seal). The water column of 2000 decibars is divided into 200 layers with regular vertical thicknesses of 10 decibars. If there is only one vertical profile in a grid cell, the profile is averaged at 10 decibars through the water column. The mean vertical profile in that grid cell will therefore be the result of that single profile. If there are multiple measurements in a single grid cell, each vertical profile of temperature is first averaged at 10 decibars individually and hereafter the mean of averages is then taken to create a single vertical profile for the grid cell.
| PLATFORM | FIRST DATA ACQUISITION | LAST DATA ACQUISITION | NUMBER OF PROFILES |
| Argo floats | 2001-12-21 15:53:45 | 2019-07-04 19:53:14 | 64,378 |
| Elephant Seals | 2004-01-27 11:48:59 | 2018-01-14 23:00:00 | 118,767 |
Table 1 – Time period of data and number of profiles collected by Argo floats and Elephant Seals in the Southern Ocean.
Results
Argo floats have covered a wider area and profiled water columns deeper than 2000 decibars in the SO (fig1a). Seal data are concentrated in the first 500 decibars and remarkably cover nearshore and offshore waters between 20ºE and 130ºE (Fig.1b). The seal data also cover the gap near the coast, from the northern tip of the Antarctic Peninsula to southeastern Amundsen Sea. Figure 2 shows the number of profiles sampled by floats Argo (fig.2a) and seals (fig.2b) within grid cells of 0.5 degree latitude and longitude. Argo data are dominant in the Belingshausen, Amundsen, Weddell, and Lazarev seas. The largest number of vertical profiles are found at the eastern contour of the Weddell Gyro and Mawson Sea, indicating more than 25 profiles per grid cell. Roughly 20 profiles per grid cell were also sampled off shore in the Ross Sea as well as over areas over the Antartic Basin. Largest numbers of vertical profiles sampled by seals were found in the Amery Ice Shelf area, between Mawson Station (67º36’S-62º52’SW) and West Ice Shelf (60º40’S-85ºW), and the Knox coast (that lies between Cape Hordern, at 100º31’E, and the Hatch Islands, at 109º16’E). A significant amount of seal data are observed near Cape Filcher, and across Davis and Mawson seas.
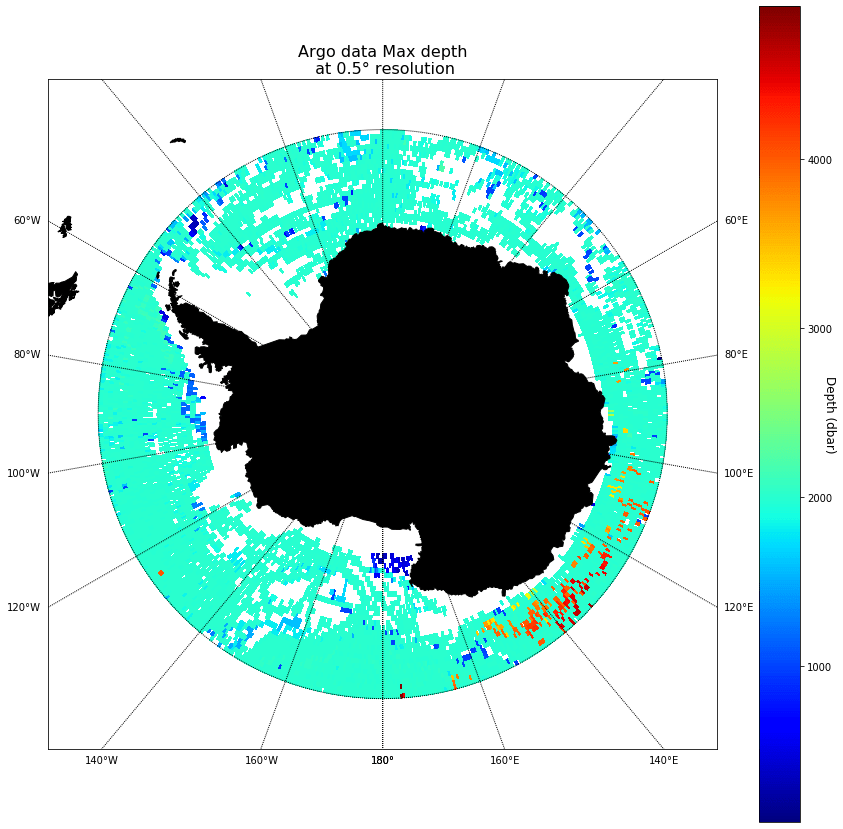
Fig 1. a
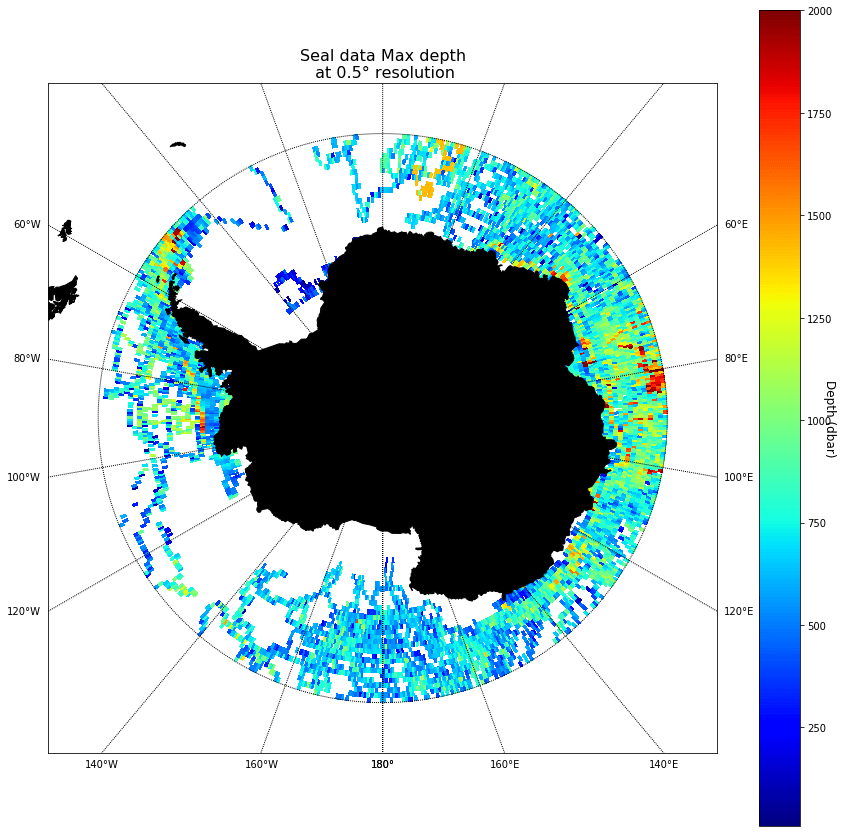
Fig 1. b
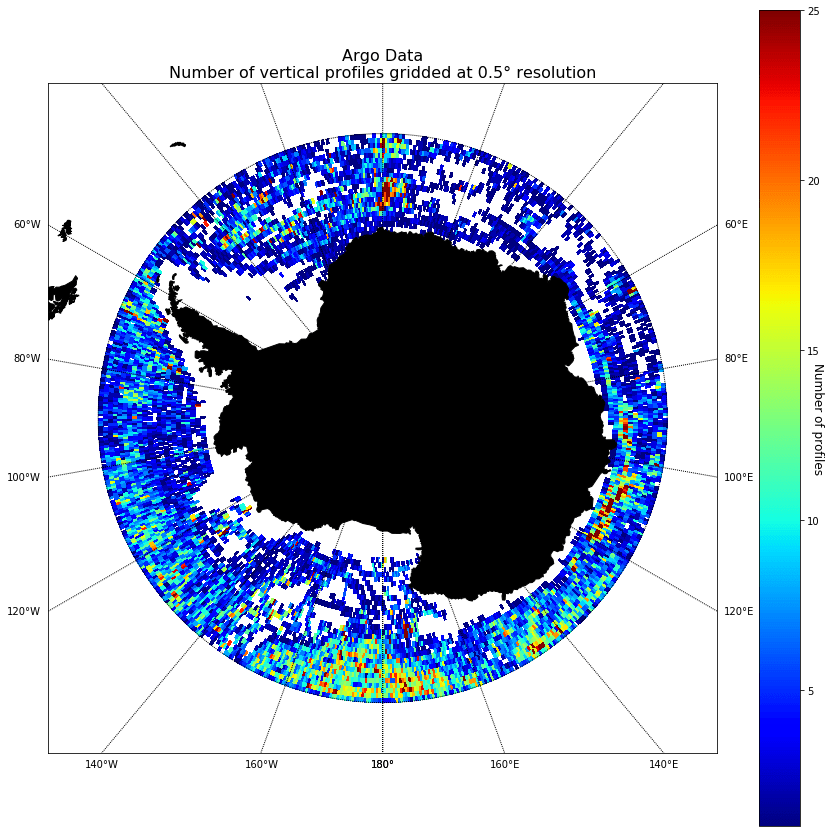
Fig 2. a
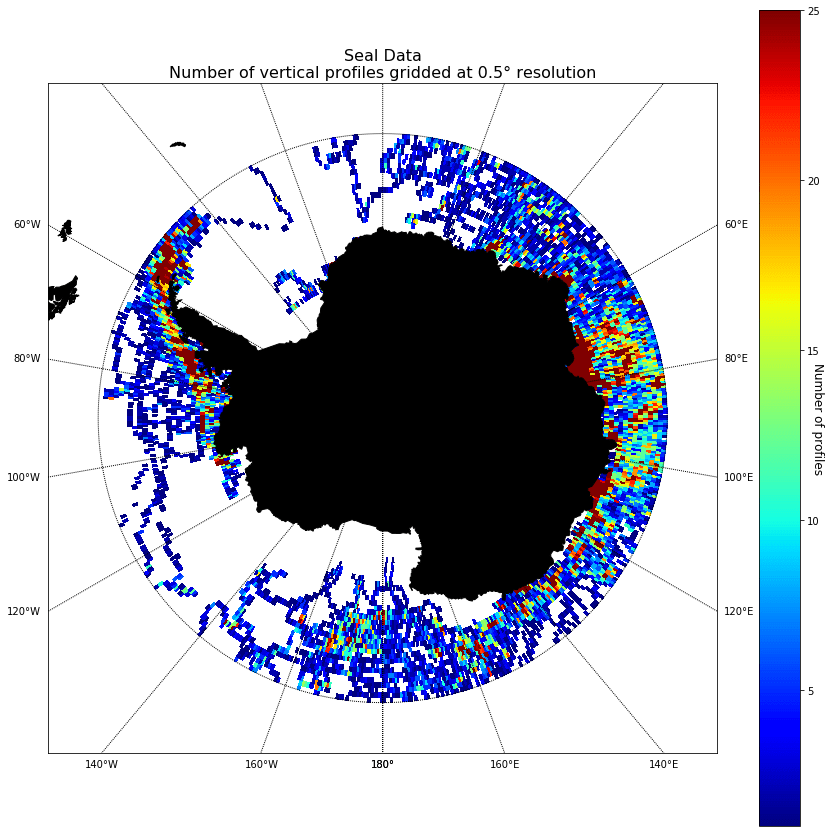
Fig 2. b
Fig 1. Location and maximum depth profiled in the water column collected by (a. left) Argo floats and (b. right) Elephant Seals in the Southern Ocean. Horizontal grid is 0.5 degrees latitude by longitude resolution.
Figure 2 – Number of profiles sampled by (a. left) Argo floats and (b. right) Elephant Seals gridded at 0.5º latitude and longitude from 60ºS to 75ºS. Colours represent the number of profiles.
Climatology fields
Figure 3 presents the temperature climatological mean field (Argo + Seal combined) gridded at 0.5° latitude and longitude for two layers. The topmost layer features temperature ranging from near -2ºC up to 7ºC. This layer is occupied by the Antarctic Surface Water (AASW), which is recognised for temperatures typically above the freezing point, but may reach up to 2ºC near the Polar Front, or where deeper and relatively warmer water approaches the surface (Carter et al, 2008; Emery, 1986). Two large ocean water bodies, marking temperature between 2ºC and 7ºC off the Bellingshausen and Ross seas, meet with the cold AASW at about 65ºS latitude. The boundary that outlines the convergence between the AASW and the relatively warm waters from the north describes the southernmost retreat of the Polar Front in the SO. Roughly between 42ºW and 82ºE (clockwise), AASW crosses the SO from the Antarctic continental shelf to the latitude of 60ºS indicating the northernmost extent of the temperature minimum at surface. At 300 dbar, the temperature climatological mean field (TCMF) reveals waters below 0ºC surrounding the Antarctic continent, near the shore. Offshore, roughly between 55WºW and 20ºE (clockwise), the TCMF shows relatively warm waters (1.5ºC-2.3ºC) covering the largest area in the SO. In addition, two core of warmer waters in the Bellingshausen and Ross seas present the highest temperatures at this vertical level, roughly from 2.5ºC to 4.8ºC, between 60ºS and 64ºS.
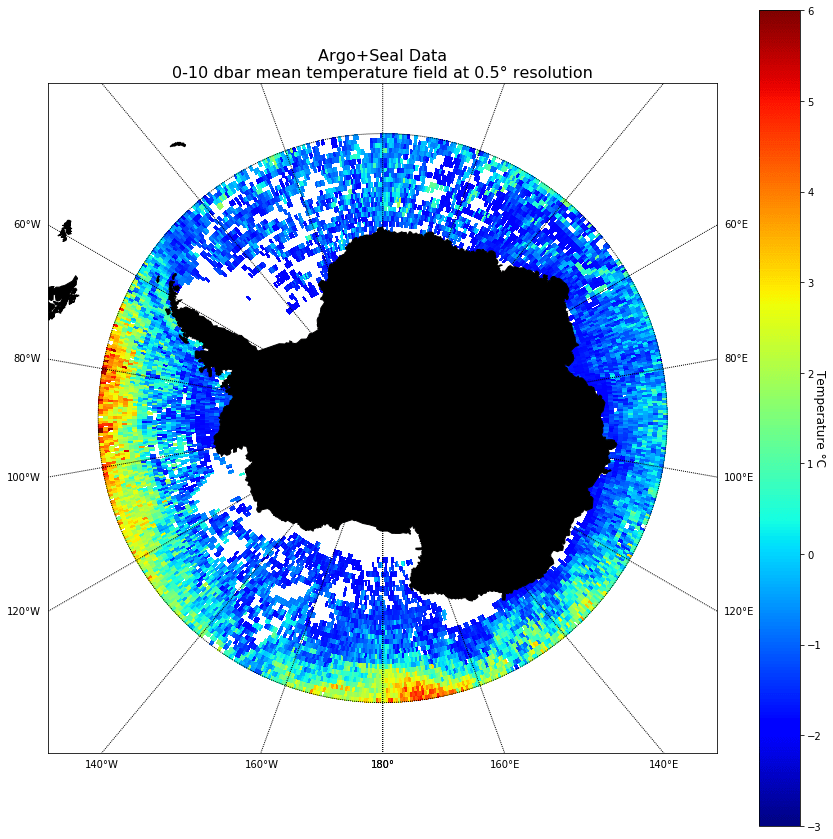
Fig. 3 a
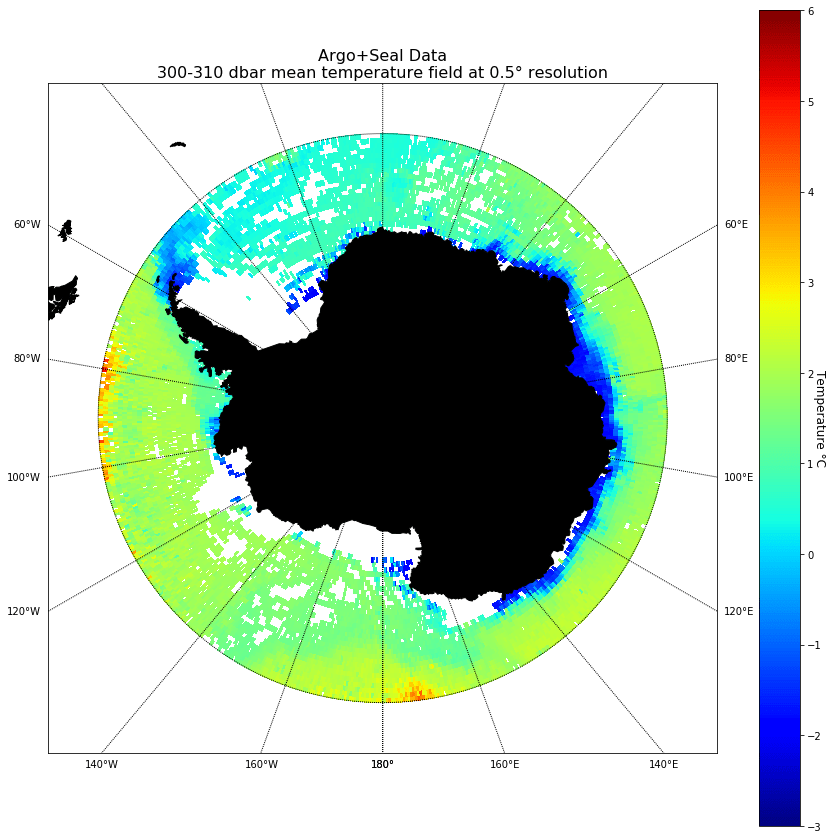
Fig. 3 b
Figure 3. Temperature mean field (argo+seal) gridded at 05º latitude and longitude from 60ºS to 75ºS. Horizontal sections are averaged between (a) 0-10dbar and (b) 300-310dbar. Colours represent the temperature in ºC.
Seasonal mean fields
Figures 4 and 5 show the temperature seasonal mean fields (Argo + Seal combined), gridded at 0.5° latitude and longitude for two levels in the water column (left-300dbar; right-750dbar). For these examples, the data are classified as if there were only two long seasons during the year: a six months’ summer season (October through March); and six months’ winter season (April through September). There is a large volume of data sampled by seals in the winter, filling important gaps by expanding data coverage between 15°E and 130°E. However, deeper into the water column, the volume of data collected by seals decreases significantly. Only a few profiles exceed the depth of 760dbar. In summary, both seals and Argo floats have played an important role in the acquisition of ocean observations that will help estimate a winter climatology for the SO, which has previously been unreachable because of the seasonally ice-covered section of this ocean.
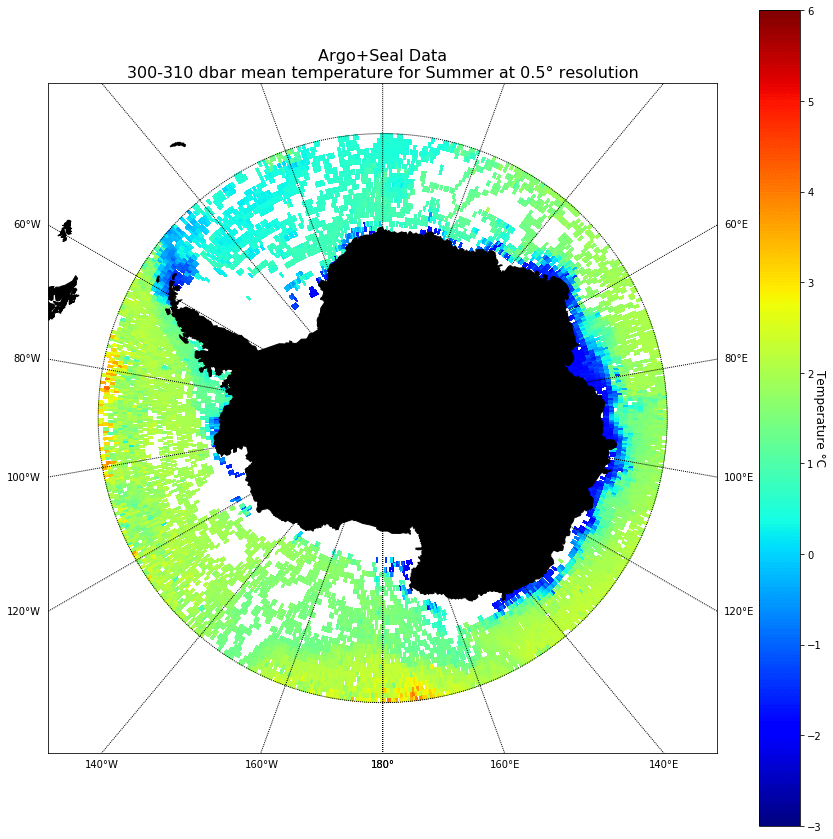
Fig 4. a
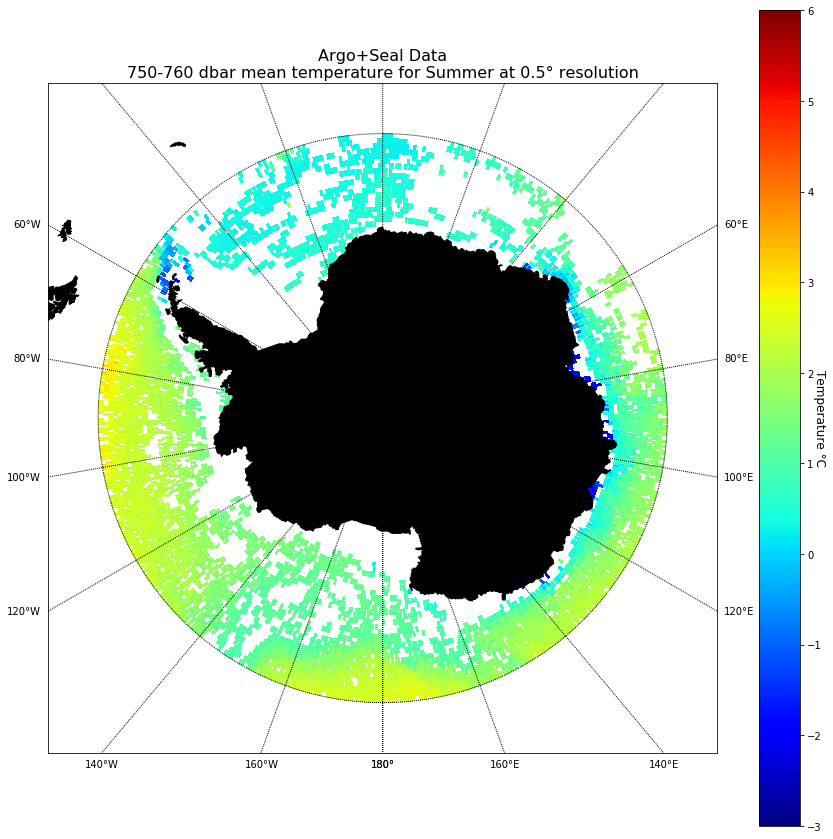
Fig 4. b
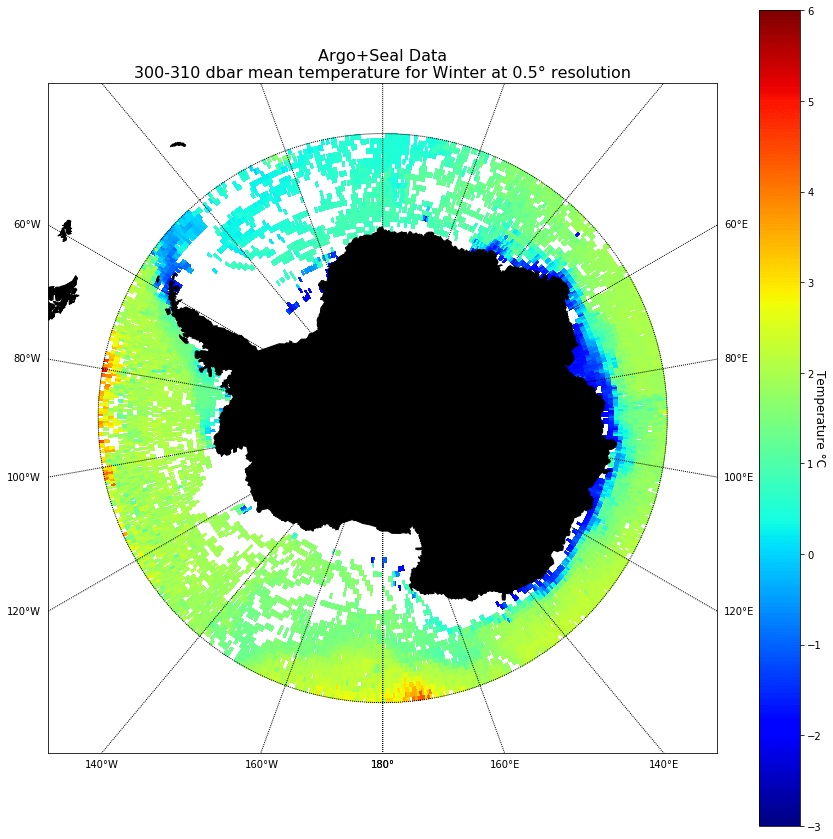
Fig 5. a
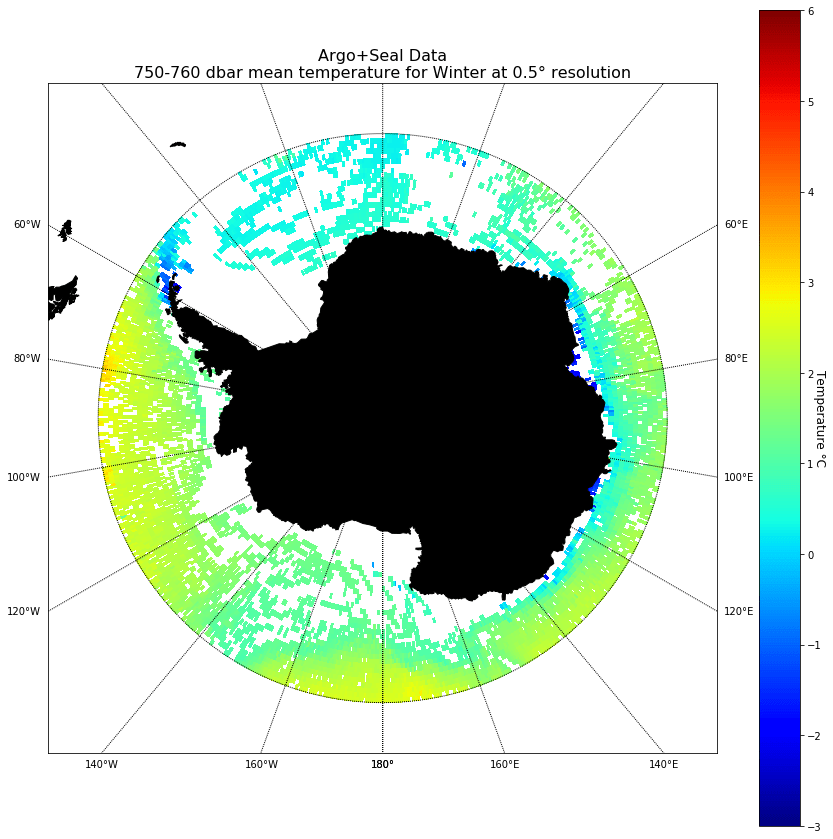
Fig 5. b
Figure 4. Summer temperature mean field (argo+seal). Horizontal sections are gridded at 05º latitude and longitude from 60ºS to 75ºS, and averaged between (a. left) 300-310dbar and (b. right) 750-760dbar. Colours represent the temperature in ºC.
Figure 5. Winter mean temperature field (argo+seal). Horizontal sections are gridded at 05º latitude and longitude from 60ºS to 75ºS, and averaged between (a. left) 300-310dbar and (b. right) 750-760dbar. Colours represent the temperature in ºC.
Monthly mean fields
The dataset was sorted by months (January, February, …, December) to arrange the monthly temperature mean fields according to the 1° horizontal resolution grid system. This grid system (1ºLat x1ºLon) was initially chosen due to lack of data at monthly resolution. Figures 6 and 7 show examples of the monthly temperature mean fields for the topmost layer (0-10dbar) of the SO. The monthly mean fields for June and December are presented for Argo floats (left) and seals (right). It is noteworthy that there are more vertical profiles collected by Argo in December than in June. On the other hand, there is more data collected by seals in June than in December.
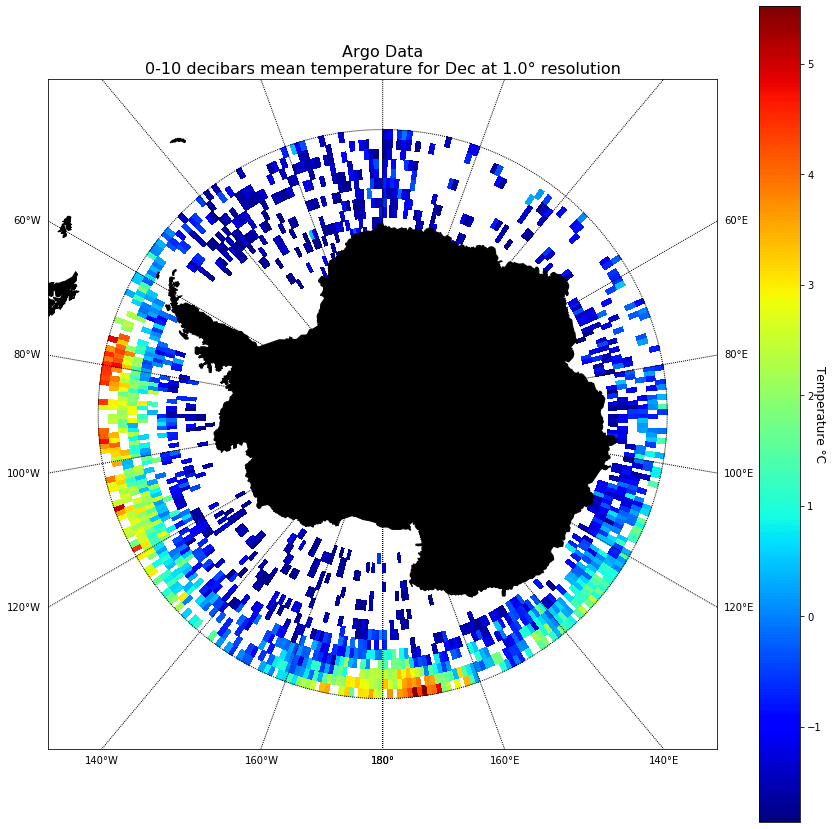
Fig 6. a

Fig 6. b

Fig 7. a

Fig 7. b
Figure 6 – Monthly mean temperature fields for December. Temperature data are from (a. left) Argo floats and (b. right) elephant seals. Horizontal sections are gridded at 1º latitude and longitude from 60ºS to 75ºS, and vertically averaged between 0-10dbar. Colours represent the temperature in ºC.
Figure 7 – Monthly mean temperature fields for December. Temperature data are from (a. left) Argo floats and (b. right) elephant seals. Horizontal sections are gridded at 1º latitude and longitude from 60ºS to 75ºS, and vertically averaged between 0-10dbar. Colours represent the temperature in ºC.
Discussion
The amount of data currently available has contributed significantly to the studies of the physical properties of seawater in the SO. However, these observations are irregularly sampled in space and time. Spatial and temporal interpolation techniques were used to provide evenly arranged data fields in time and space from irregularly sampled data.There are more profiles sampled by seals than Argo. Although, Argo data cover a wider area and deeper waters in the SO. Argo floats are the dominant platform in collecting oceanographic data off shore the Bellingshausen, Amundsen, Weddell and Ross seas. Seal data fill important gaps in nearshore waters around Antarctica, including the northern tip and western coast of the Antarctica Peninsula, and particularly off shore waters between 15ºE and 130ºE. In general, most profiles sampled by seals reach roughly the first 600 decibars only. A few vertical profiles exceeded the depth of 1000 decibars and there are no records for the grid’s deepest layer (1990-2000 dbar).
The mean climatological and seasonal fields in the SO are well represented by the grid system designed at half a degree of latitude and longitude. It is important to assess whether the application of specialised interpolation methods will alter the mean climatological fields compared to the use of data in the grid by means of a simple average as has been done so far. Despite efforts by the scientific community and massive investments made to increase direct observations in the SO, the amount of data available is still insufficient to create a monthly climatology at 1º. It is necessary to reassess that chosen grid system and create a coarser resolution grid system for the estimation of the monthly mean fields. Instead of creating a monthly climatology using data sampled by Argo floats and elephant seals, it is recommended that a slightly reduced temporal scale (seasonal scale) be used. This will ensure a more consistent and coherent means for analysis due to lack of monthly data and will create a more robust winter and summer climatology for the SO. Last, but by no means least, this study also contributes toward seeking better strategies to indicate where data acquisition platforms should be launched in order to play a more directive role in future studies.
ACKNOWLEGMENT
The author thanks e-research group, HackyHour@Auckland, and The Carpentries (UoA) on the introductory computational skills needed for data management. The author also thanks Nick Young for his crucial support and exchanges in regards to code in Python and GitHub.
BIBLIOGRAPHY
- Carter, L. and McCave, I. N. and Williams, M. J. M. (2008) Circulation and water masses of the Southern Ocean: a review. In: Antarctic Climate Evolution. Developments in earth and environmental sciences (8). Elsevier, Amsterdam. ISBN 978-0-444-52847-6
- Emery, W. J., and Meincke, J. (1986). Global water masses: summary and review. Oceanologica acta, 9(4), 383-391.
- Roemmich, D., and Gilson, J. (2009). The 2004–2008 mean and annual cycle of temperature, salinity, and steric height in the global ocean from the Argo Program. Progress in oceanography, 82(2), 81-100.
- Roquet, F., et al. (2013). Estimates of the Southern Ocean general circulation improved by animal‐borne instruments. Geophysical Research Letters, 40(23), 6176-6180.
See more case study projects

Our Voices: using innovative techniques to collect, analyse and amplify the lived experiences of young people in Aotearoa
Painting the brain: multiplexed tissue labelling of human brain tissue to facilitate discoveries in neuroanatomy

Detecting anomalous matches in professional sports: a novel approach using advanced anomaly detection techniques

Benefits of linking routine medical records to the GUiNZ longitudinal birth cohort: Childhood injury predictors
Using a virtual machine-based machine learning algorithm to obtain comprehensive behavioural information in an in vivo Alzheimer’s disease model
Mapping livability: the “15-minute city” concept for car-dependent districts in Auckland, New Zealand

Travelling Heads – Measuring Reproducibility and Repeatability of Magnetic Resonance Imaging in Dementia
Novel Subject-Specific Method of Visualising Group Differences from Multiple DTI Metrics without Averaging

Re-assess urban spaces under COVID-19 impact: sensing Auckland social ‘hotspots’ with mobile location data
Aotearoa New Zealand’s changing coastline – Resilience to Nature’s Challenges (National Science Challenge)
Proteins under a computational microscope: designing in-silico strategies to understand and develop molecular functionalities in Life Sciences and Engineering
Coastal image classification and nalysis based on convolutional neural betworks and pattern recognition
Determinants of translation efficiency in the evolutionarily-divergent protist Trichomonas vaginalis
Measuring impact of entrepreneurship activities on students’ mindset, capabilities and entrepreneurial intentions

Using Zebra Finch data and deep learning classification to identify individual bird calls from audio recordings

Automated measurement of intracranial cerebrospinal fluid volume and outcome after endovascular thrombectomy for ischemic stroke
Using simple models to explore complex dynamics: A case study of macomona liliana (wedge-shell) and nutrient variations
Fully coupled thermo-hydro-mechanical modelling of permeability enhancement by the finite element method
Modelling dual reflux pressure swing adsorption (DR-PSA) units for gas separation in natural gas processing
Molecular phylogenetics uses genetic data to reconstruct the evolutionary history of individuals, populations or species

Wandering around the molecular landscape: embracing virtual reality as a research showcasing outreach and teaching tool


