Hosting visualisation and analytics tools for COVID-19 studies
Professor Shaun Handy, the Director of New Zealand Centre of Research Excellence Te Pūnaha Matatini (TPM); Daniel Barnett from the Department of Statistics and the study is led by Andrew Sporle, Honorary Academic from Department of Statistics and Director of iNZight Analytics Ltd. Platform and Services, Centre for eResearch
Nectar research cloud for public access
The Centre for eResearch is actively supporting several COVID-19 related projects at the University and on the national level during 2020 pandemic. These projects range from advising on Qualtrics platform used by Growing Up in New Zealand (GUiNZ), developing daily data transfer scripts for a complex contagion model to hosting two interactive COVID-19 modelling applications for public access to support a large number of users. Examples briefly described below:
COVID-19, Take Control
The eResearch Platform and Services team has been working with Professor Shaun Handy, the Director of New Zealand Centre of Research Excellence Te Pūnaha Matatini (TPM) to host the “COVID-19 Take Control” simulation tool. The application, developed by Audrey Lustig from Landcare Research, is not a decision-making tool but rather a model that illustrates and communicates with the public, and allows users to simulate how the COVID-19 pandemic might play out in Aotearoa, New Zealand under different conditions of collective cooperation. For example, the simulator models the effects of social distancing and hand washing hygiene. For detail exploration, visit (http://covid19takecontrol.nectar.auckland.ac.nz/covid19_takeControl/)
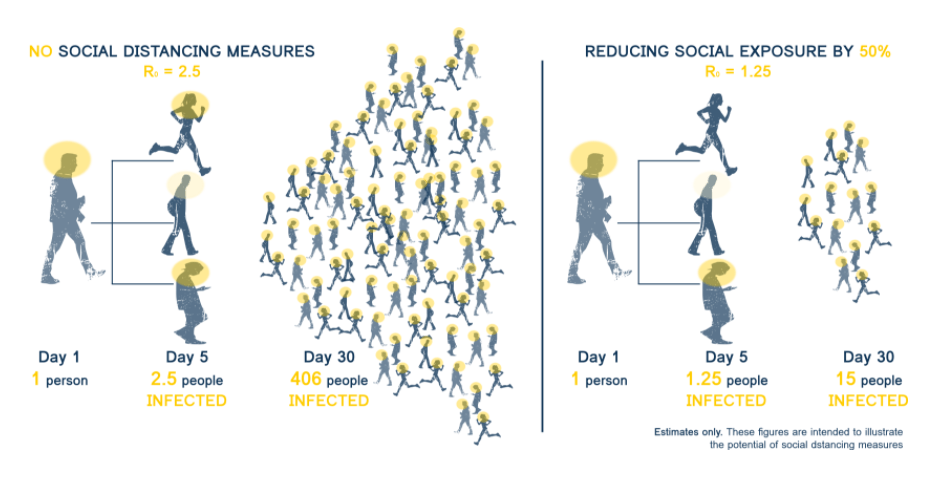
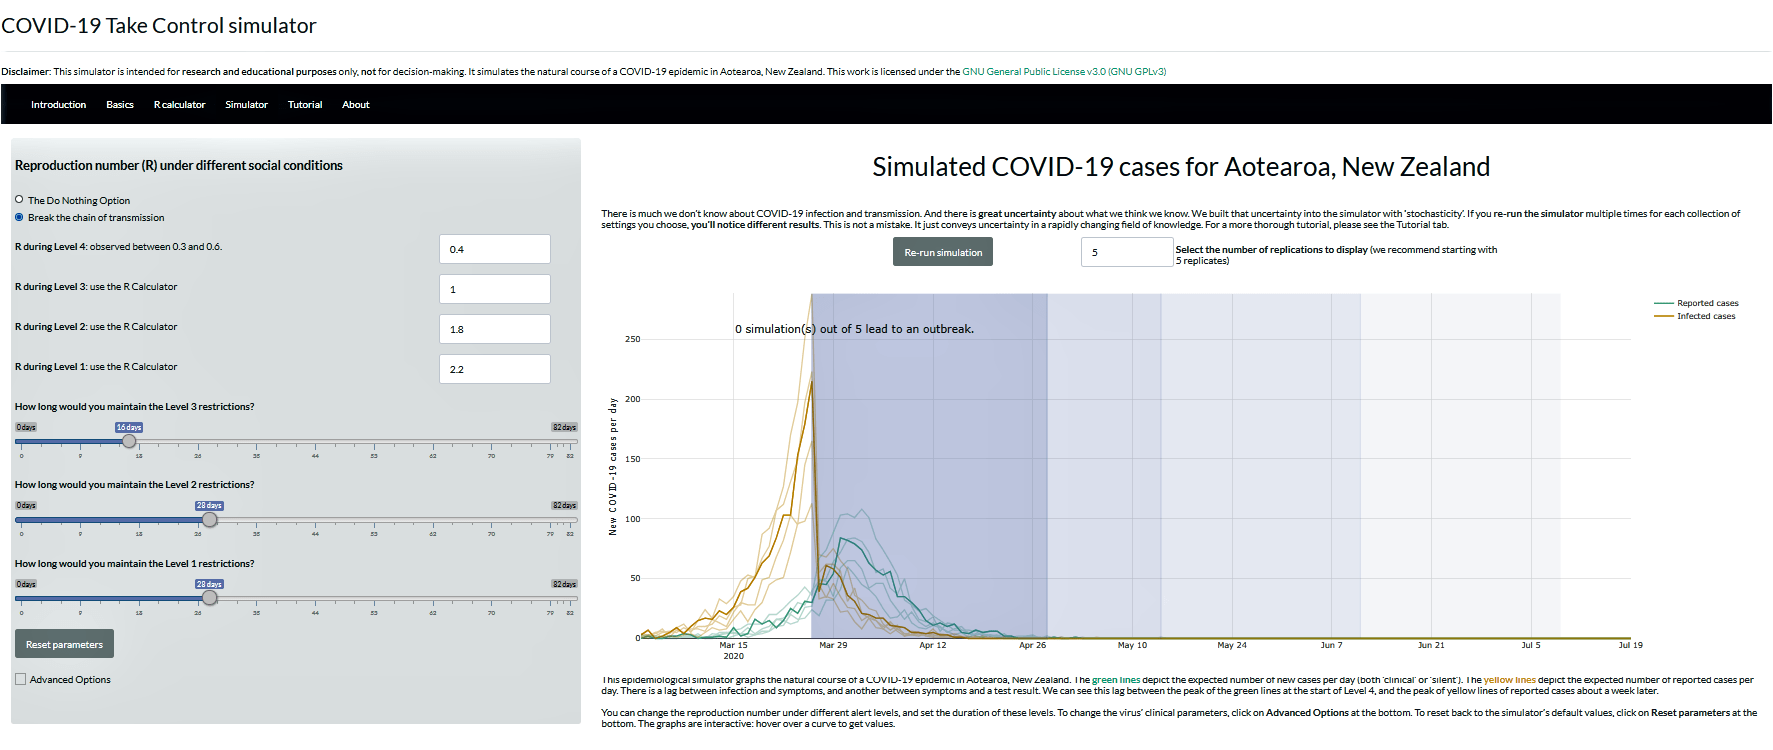
Fig 1. Simulating how different social conditions affect COVID-19 infection numbers. This epidemiological simulator graphs the natural course of a COVID-19 epidemic in Aotearoa, New Zealand. The green lines depict the expected number of new cases per day (both ‘clinical’ or ‘silent’). The yellow lines depict the expected number of reported cases per day. There is a lag between infection and symptoms, and another between symptoms and a test result. We can see this lag between the peak of the green lines at the start of Level 4, and the peak of yellow lines of reported cases about a week later. You can change the reproduction number under different Alert Levels, and set the duration of these levels.
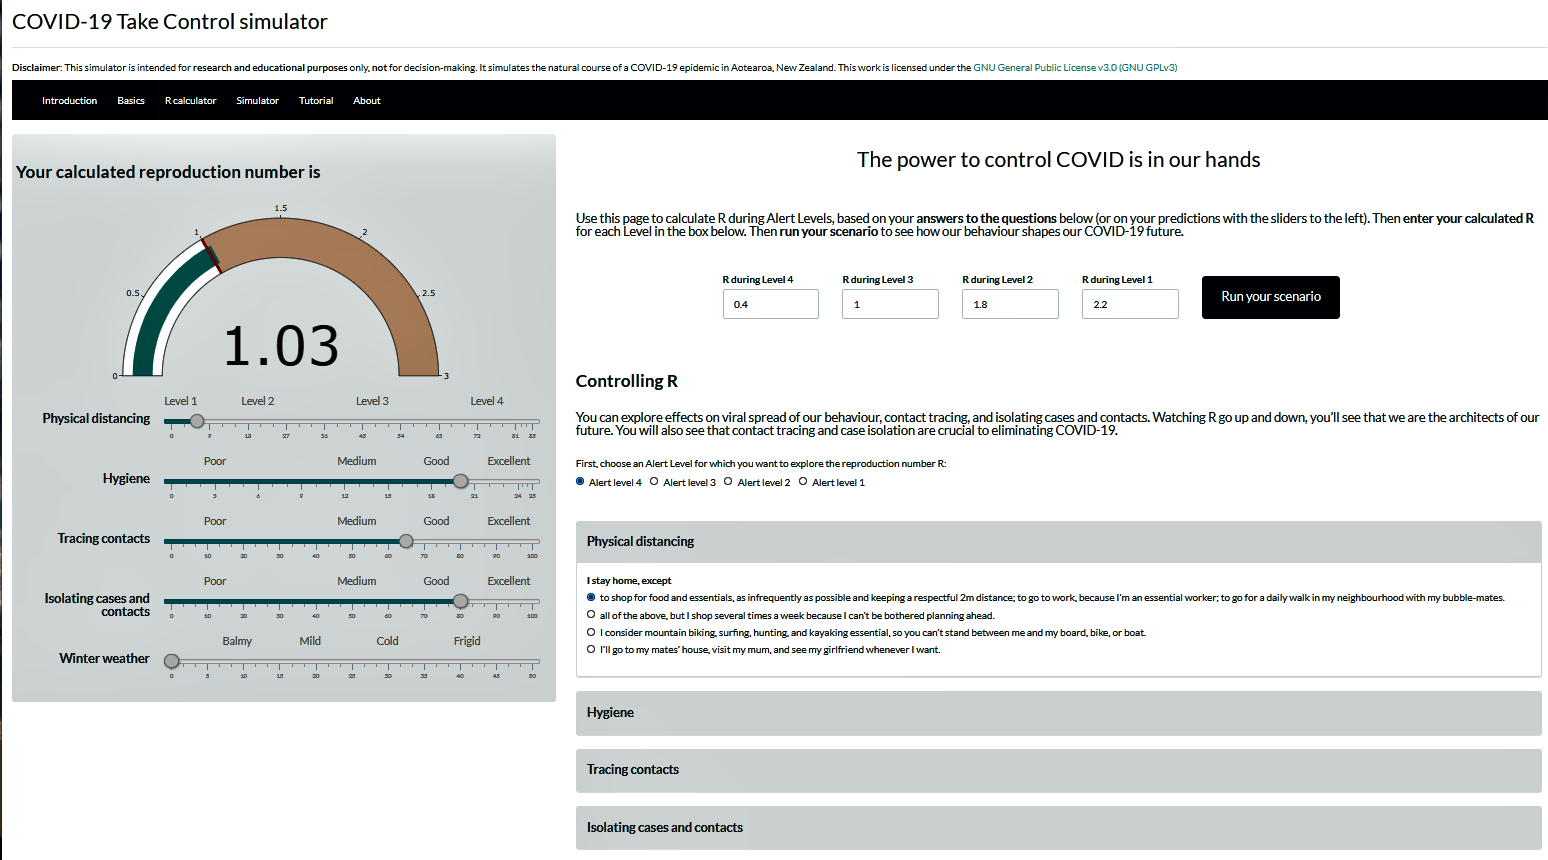
Fig 2. Controlling R. Explore effects on viral spread of our behaviour, contact tracing, and isolating cases and contacts. Calculate R during Alert Level and based on user’s answers to the questions and run the scenario to see how our behaviour shapes the COVID-19 future.
New Zealand COVID-19 Outcome Modelling and Visualisation
The New Zealand government has adopted a strategy of eliminating the virus from the population. Should elimination not be achieved, the strategy is to mitigate the spread of the disease throughout the population. Overseas reports of the COVID-19 epidemic indicate that it is having different impacts on different populations, ages, and regions. If the epidemic is not controlled in New Zealand, we can expect similar differences in impacts for different populations based on current overseas experience and the high levels of unequal impact of previous New Zealand epidemics. Extra support focused on vulnerable communities can ensure those in needs are maximally protected if elimination fails.
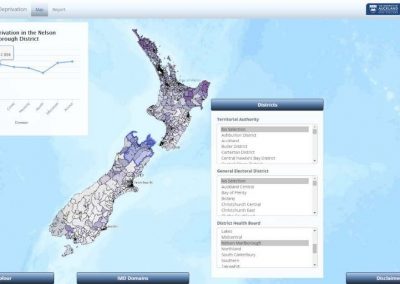
This tool enables the modelling of a range of possible scenarios if elimination is not successful. It provides an easy to use way to model various outcomes at national and DHB level using the currently available knowledge about the disease. This information is intended to inform intervention at the early stages of the epidemic using low population infection rates. Using higher population infection rates can demonstrate the potential impact if both elimination and mitigation strategies were not successful and the epidemic ran its course in the NZ population. The tool was developed by Daniel Barnett from the Department of Statistics and the study is led by Andrew Sporle, Honorary Academic from Department of Statistics and Director of iNZight Analytics Ltd. The work is also supported by Professor Shaun Hendy of TPM. For detail exploration, software and references, visit (http://nzcovid19equity.nectar.auckland.ac.nz/covid19-modelling/).
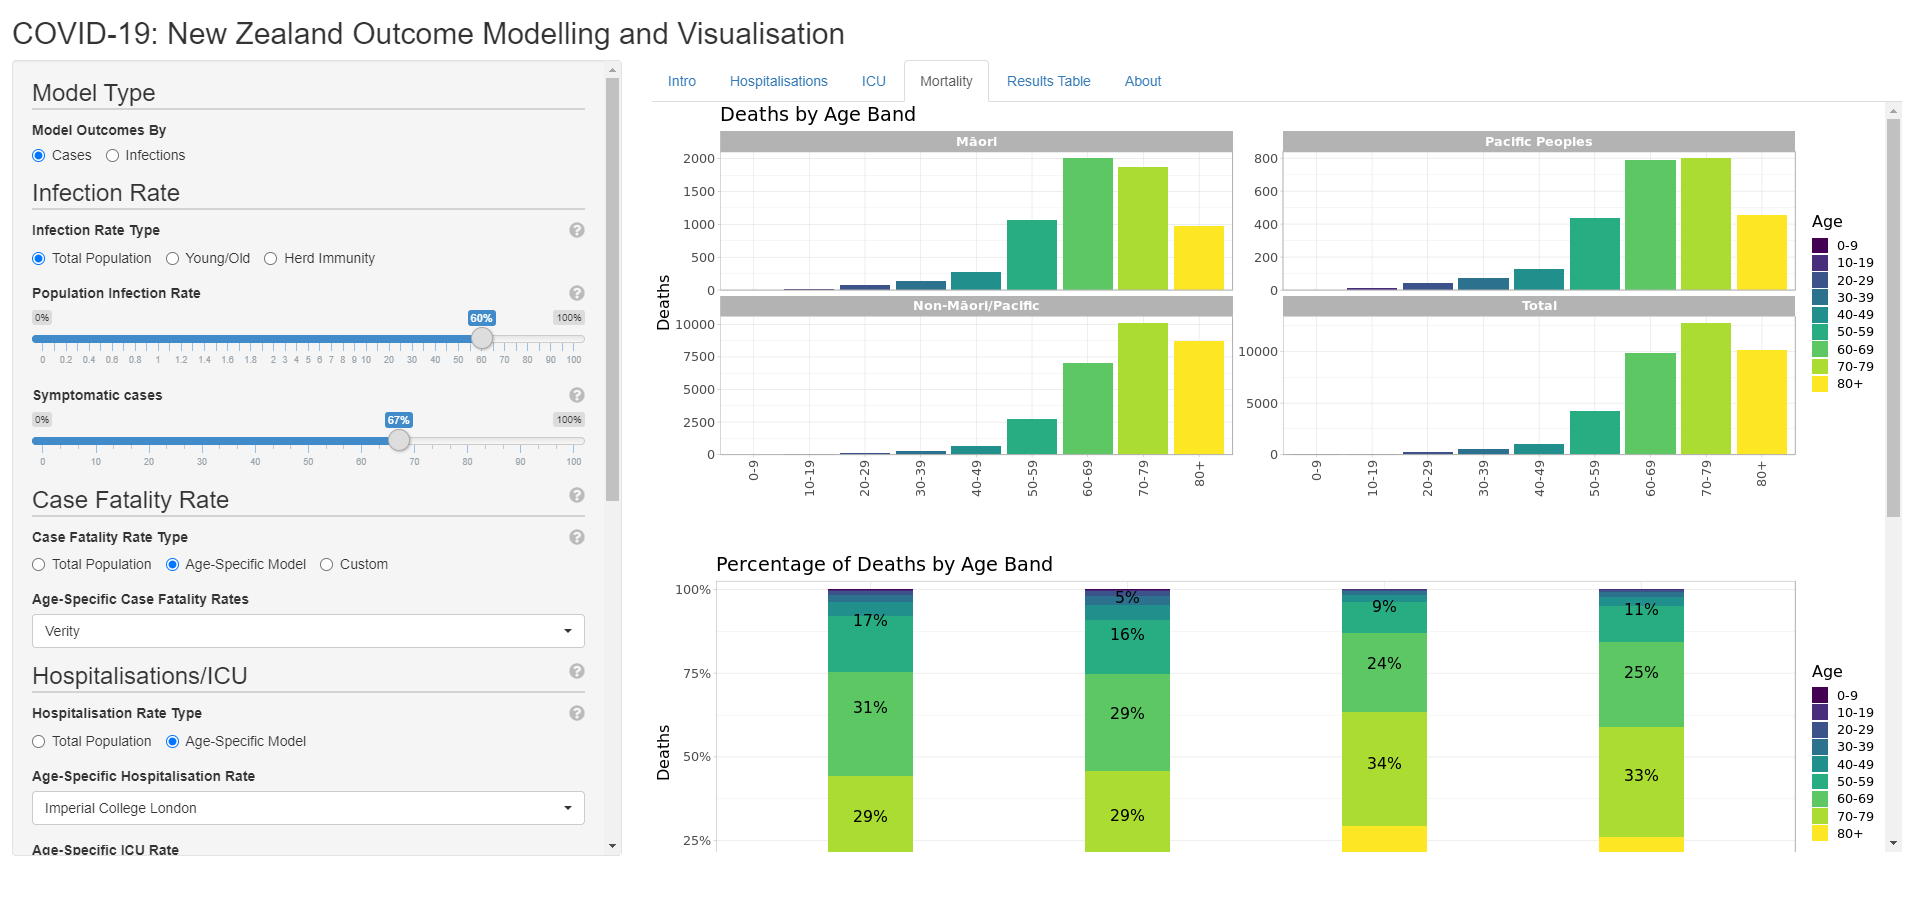
NZ Covid-19 visualisation dashboard showing the hospitalisation rate on age-specific model based on Imperial College London model.
See more case study projects

Our Voices: using innovative techniques to collect, analyse and amplify the lived experiences of young people in Aotearoa
Painting the brain: multiplexed tissue labelling of human brain tissue to facilitate discoveries in neuroanatomy

Detecting anomalous matches in professional sports: a novel approach using advanced anomaly detection techniques

Benefits of linking routine medical records to the GUiNZ longitudinal birth cohort: Childhood injury predictors
Using a virtual machine-based machine learning algorithm to obtain comprehensive behavioural information in an in vivo Alzheimer’s disease model
Mapping livability: the “15-minute city” concept for car-dependent districts in Auckland, New Zealand
Travelling Heads – Measuring Reproducibility and Repeatability of Magnetic Resonance Imaging in Dementia
Novel Subject-Specific Method of Visualising Group Differences from Multiple DTI Metrics without Averaging
Re-assess urban spaces under COVID-19 impact: sensing Auckland social ‘hotspots’ with mobile location data
Aotearoa New Zealand’s changing coastline – Resilience to Nature’s Challenges (National Science Challenge)
Proteins under a computational microscope: designing in-silico strategies to understand and develop molecular functionalities in Life Sciences and Engineering
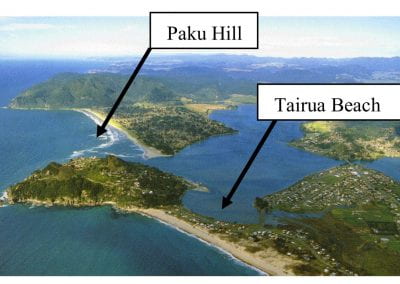
Coastal image classification and nalysis based on convolutional neural betworks and pattern recognition
Determinants of translation efficiency in the evolutionarily-divergent protist Trichomonas vaginalis
Measuring impact of entrepreneurship activities on students’ mindset, capabilities and entrepreneurial intentions

Using Zebra Finch data and deep learning classification to identify individual bird calls from audio recordings
Automated measurement of intracranial cerebrospinal fluid volume and outcome after endovascular thrombectomy for ischemic stroke
Using simple models to explore complex dynamics: A case study of macomona liliana (wedge-shell) and nutrient variations
Fully coupled thermo-hydro-mechanical modelling of permeability enhancement by the finite element method
Modelling dual reflux pressure swing adsorption (DR-PSA) units for gas separation in natural gas processing
Molecular phylogenetics uses genetic data to reconstruct the evolutionary history of individuals, populations or species

Wandering around the molecular landscape: embracing virtual reality as a research showcasing outreach and teaching tool


