Improving diagnosis for schistosomiasis by using the ‘metabolic footprint’ of urine samples from an animal model of Schistosoma infection to identify possible biomarkers
Rodrigo Loyo, Masters student, Brazil; Dr Augusto Barbosa, Supervisor, Biology Sciences; Dr Constança Simões Barbosa, Supervisor, Brazil; Dr Erica Zarate, Senior Technician GC-MS, Mass Spectrometry Centre
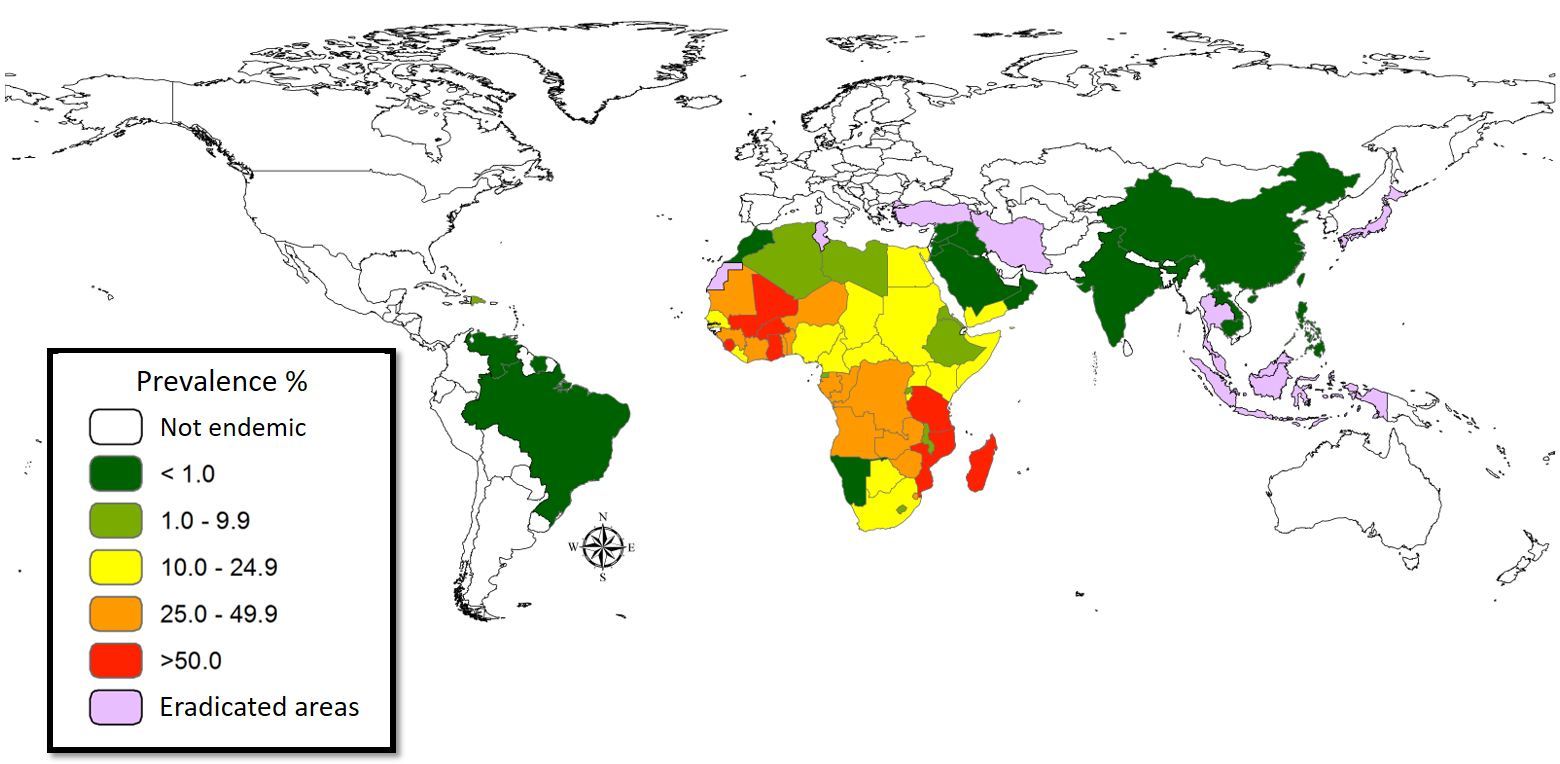
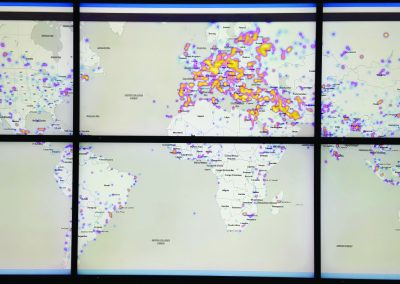
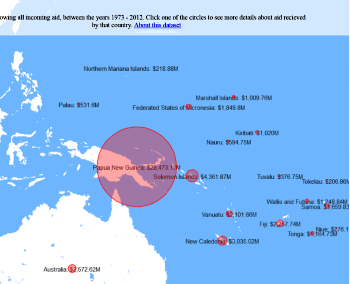
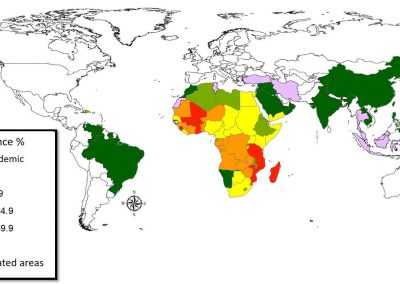
Figure 1. The world map showing the prevalence data of schistosomiasis in several countries.
Overview
Schistosomiasis is a neglected tropical disease caused by a trematode of the genus Schistosoma. The majority of human infections are attributable to the three species: S. haematobium, S. mansoni and S. japonicum (1). For S. mansoni, some eggs leave the body in the faeces and hatch in water to liberate miracidium larvae, which infect certain types of freshwater snails (2). Within the snail, the parasites multiply asexually to produce free-swimming cercariae larvae, and these then infect people by skin penetration (3). The adults do not multiply in the body but instead live there for several years, producing eggs (4).
Schistosomiasis infection constitutes a major public health problem, particularly in countries where the disease is endemic. Worldwide (Figure 1), it is estimated 779 million people at the risk of contracting schistosomiasis, while about 210 million are infected with the disease (5). The acute or short-term consequences of schistosomiasis infection include skin rashes, fever and fatigue, while chronic or long-term effects involve damage to internal organs such as the liver, spleen and gall bladder.
Traditionally, the schistosomiasis diagnosis has been performed by direct parasitological techniques, such as the Kato–Katz method (6). However, in cases of a low infections the Kato-Katz method is not efficient and may be detected by means of serological immunodiagnostic tests or molecular techniques (7–10). Alternative methods for the schistosomiasis diagnosis can potentially be identified through metabolomics studies, wherein the metabolites found associated with Schistosoma infections (e.g., in an animal’s blood, stool or urine) are profiled to identify characteristic biomarkers.
Research collaboration
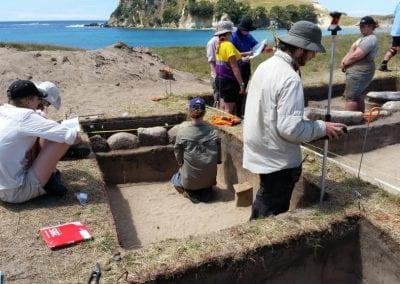
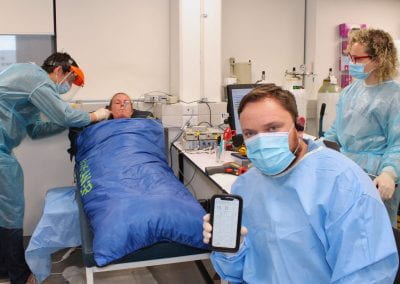
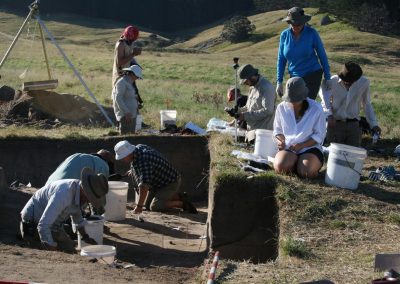
This study was a partnership between the Oswaldo Cruz Foundation (https://portal.fiocruz.br/pt-br) and the University of Auckland (UoA). The samples were obtained at the Aggeu Magalhães Institute (Brazil) and shipped to the UoA Mass Spectrometry Facility. The Mass Spectrometry facility provides the service to do metabolomics analysis for many researchers and students (Figure 2) around the University of Auckland. The GC-MS instruments and the data analysis computer are constantly in use. For this reason, this facility together with the Centre for eResearch created a virtual machine (VM) that enables a multi-user platform making the data processing easier and faster. This VM made possible a quickly way to work with all the required software and data generated by the equipment from everywhere and any computer to complete this metabolomics project.
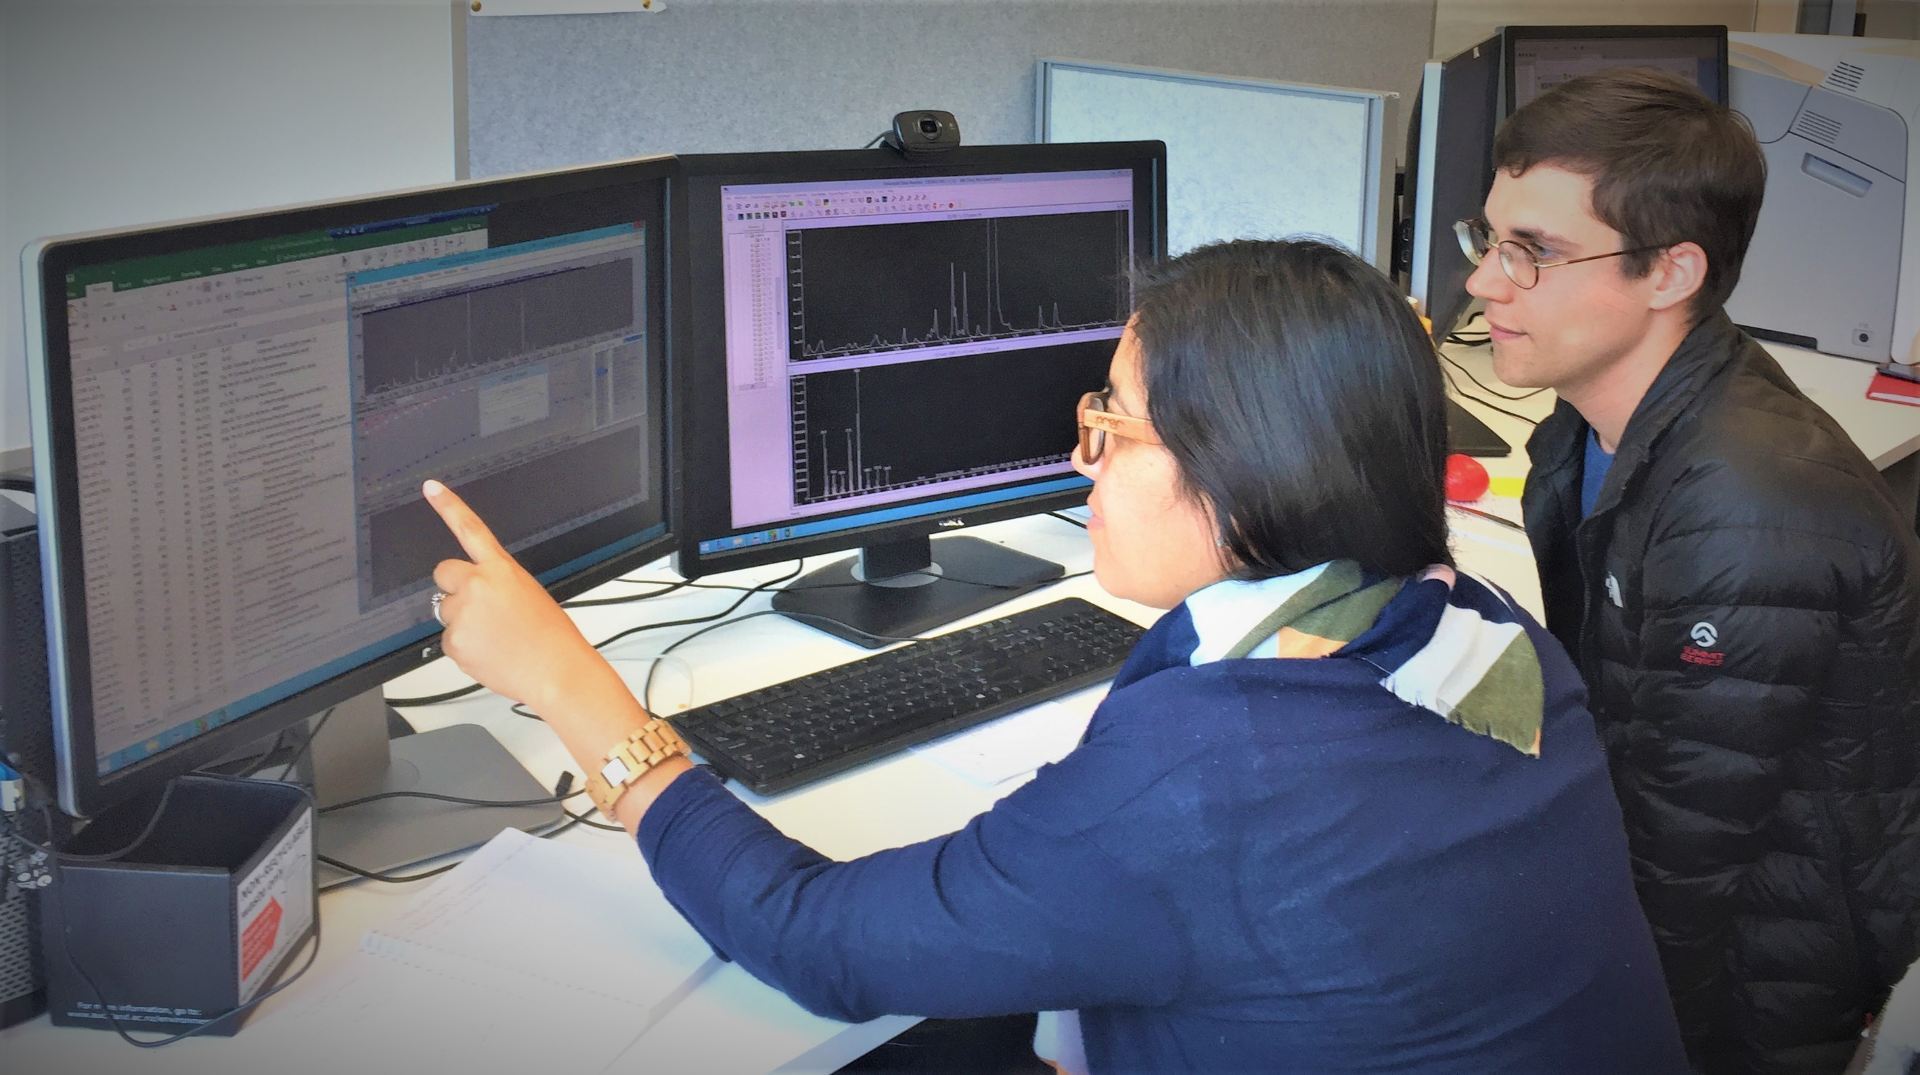
Figure 2: Example of training session using the virtual mwachine in this Metabolomics analysis.

Results
This study used the methyl chloroformate (MCF) methodology as described by Smart et al., 2010 (11) to do the metabolomics analysis. The samples were obtained from three groups of 5 mice (Figure 3). Two groups infected (low and high parasitological load) and one group not infected (used as a control).
The metabolic profile was different between groups with some metabolites contributing to these differences (Figure 4), like Hippuric acid and Alanine. The Hippuric acid was related to a low load infection as the Alanine was related to a high load infection (Figure 5).
Previous studies found similar results using different techniques (Wang et al., 2004, García-Pérez et al., 2008 and Li et al., 2011 (12–14)) showing the relevance of these metabolites to possible be used as biomarkers for schistosomiases diagnosis.
Figure 3. Result of a parasitological stool examination showing the difference between the groups.
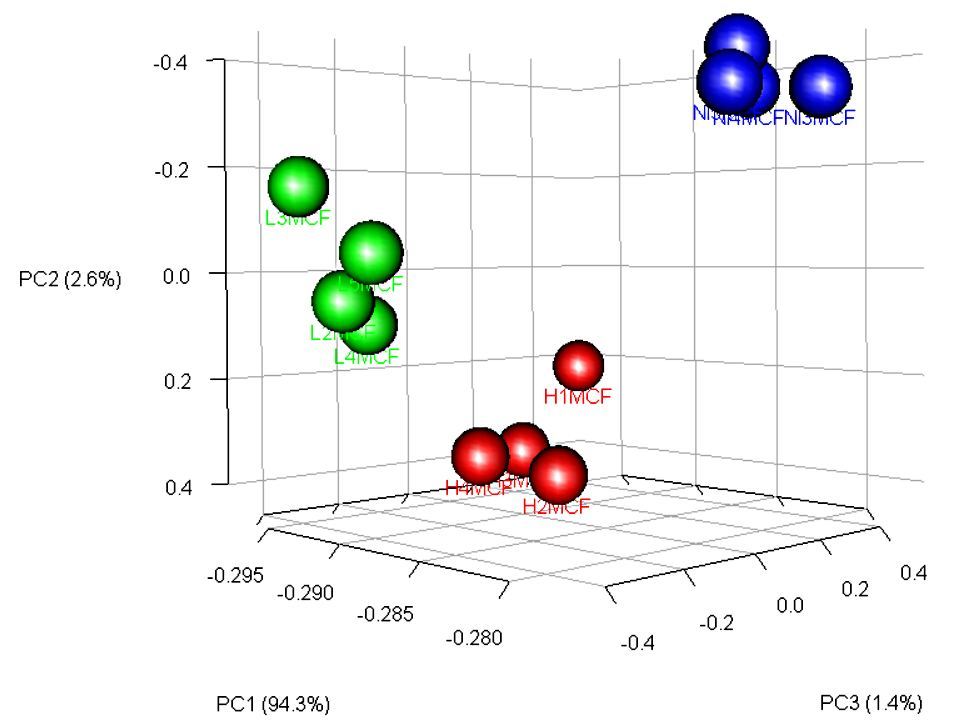
Figure 4. Principal Component Analysis (PCA) showing the separation and the groups formation.
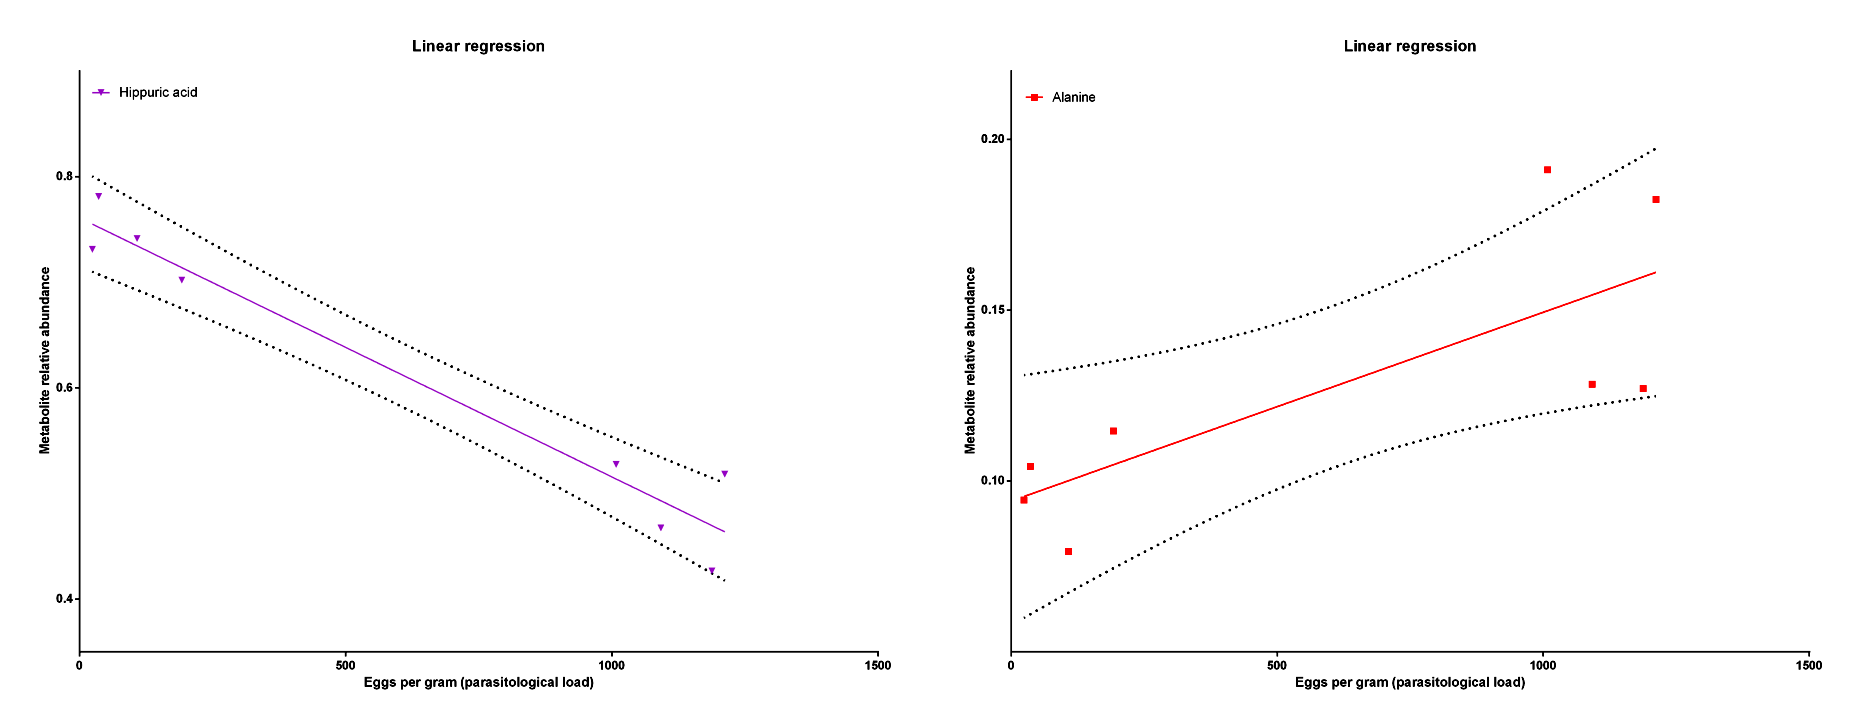
Figure 5. The linear regression showing a negative correlation between the Hippuric acid relative abundance and the parasitological load and a positive correlation between the Alanine relative abundance and the parasitological load.
- Rollinson D, Simpson AJ. The Biology of Schistosomes: From Genes to Latrines. Parasitology. London: Academic Press; 1987. 472 p.
- Gryseels B, Polman K, Clerinx J, Kestens L. Human schistosomiasis. Lancet. 2006;368(9541):1106–18.
- Wilson RA, Coulson PS. Schistosoma mansoni: dynamics of migration through the vascular system of the mouse. Parasitology [Internet]. 1986 Feb [cited 2016 Jan 14];92 (Pt 1):83–100.
- Loverde PT, Chen L. Schistosome female reproductive development. Parasitol Today [Internet]. 1991;7(11):303–8.
- Steinmann P, Keiser J, Bos R, Tanner M, Utzinger J. Schistosomiasis and water resources development: systematic review, meta-analysis, and estimates of people at risk. Lancet Infect Dis [Internet]. 2006;6(7):411–25.
- Katz N, Chaves A, Pellegrino J. A Simple Device for Quantitative Stool Thick-Smear Technique in Schistosomiasis mansoni. Rev Inst Med trop. 1972;14(6):397–400.
- Rabello A. Diagnosing Schistosomiasis. Mem Inst Oswaldo Cruz [Internet]. 1997 Sep [cited 2017 Mar 7];92(5):669–76.
- Pontes LA, Oliveira MC, Katz N, Dias-Neto E, Rabello A. Comparison of a polymerase chain reaction and the Kato-Katz technique for diagnosing infection with Schistosoma mansoni. Am J Trop Med Hyg. 2003;68(6):652–6.
- Cavalcanti MG, Silva LF, Peralta RHS, Barreto MGM, Peralta JM. Schistosomiasis in areas of low endemicity: A new era in diagnosis. Trends Parasitol. 2013;29(2):75–82.
- Gray DJ, Ross AG, Li Y-S, McManus DP. Diagnosis and management of schistosomiasis. BMJ. 2011;342(May):d2651.
- Smart KF, Aggio RBM, Van Houtte JR, Villas-Bôas SG. Analytical platform for metabolome analysis of microbial cells using methyl chloroformate derivatization followed by gas chromatography-mass spectrometry. Nat Protoc. 2010;5(10):1709–29.
- Wang Y, Holmes E, Nicholson JK, Cloarec O, Chollet J, Tanner M, et al. Metabonomic investigations in mice infected with Schistosoma mansoni: an approach for biomarker identification. Proc Natl Acad Sci U S A [Internet]. 2004;101(34):12676–81.
- García-Pérez I, Whitfield P, Bartlett A, Angulo S, Legido-Quigley C, Hanna-Brown M, et al. Metabolic fingerprinting of Schistosoma mansoni infection in mice urine with capillary electrophoresis. Electrophoresis. 2008;29(15):3201–6.
- Li J V, Saric J, Wang Y, Keiser J, Utzinger J, Holmes E. Chemometric analysis of biofluids from mice experimentally infected with Schistosoma mansoni. Parasit Vectors [Internet]. 2011;4(1):179.
See more case study projects

Our Voices: using innovative techniques to collect, analyse and amplify the lived experiences of young people in Aotearoa
Painting the brain: multiplexed tissue labelling of human brain tissue to facilitate discoveries in neuroanatomy

Detecting anomalous matches in professional sports: a novel approach using advanced anomaly detection techniques

Benefits of linking routine medical records to the GUiNZ longitudinal birth cohort: Childhood injury predictors
Using a virtual machine-based machine learning algorithm to obtain comprehensive behavioural information in an in vivo Alzheimer’s disease model
Mapping livability: the “15-minute city” concept for car-dependent districts in Auckland, New Zealand
Travelling Heads – Measuring Reproducibility and Repeatability of Magnetic Resonance Imaging in Dementia
Novel Subject-Specific Method of Visualising Group Differences from Multiple DTI Metrics without Averaging

Re-assess urban spaces under COVID-19 impact: sensing Auckland social ‘hotspots’ with mobile location data
Aotearoa New Zealand’s changing coastline – Resilience to Nature’s Challenges (National Science Challenge)
Proteins under a computational microscope: designing in-silico strategies to understand and develop molecular functionalities in Life Sciences and Engineering

Coastal image classification and nalysis based on convolutional neural betworks and pattern recognition
Determinants of translation efficiency in the evolutionarily-divergent protist Trichomonas vaginalis
Measuring impact of entrepreneurship activities on students’ mindset, capabilities and entrepreneurial intentions

Using Zebra Finch data and deep learning classification to identify individual bird calls from audio recordings
Automated measurement of intracranial cerebrospinal fluid volume and outcome after endovascular thrombectomy for ischemic stroke
Using simple models to explore complex dynamics: A case study of macomona liliana (wedge-shell) and nutrient variations
Fully coupled thermo-hydro-mechanical modelling of permeability enhancement by the finite element method
Modelling dual reflux pressure swing adsorption (DR-PSA) units for gas separation in natural gas processing
Molecular phylogenetics uses genetic data to reconstruct the evolutionary history of individuals, populations or species
Wandering around the molecular landscape: embracing virtual reality as a research showcasing outreach and teaching tool


