Mapping donor contributions in the Pacific
Associate Professor Toeolesulusulu Damon Salesa, Director, New Zealand Institute for Pacific Research. 3D visualisation by Nick Young, Research IT Specialist, Centre for eResearch, University of Auckland.
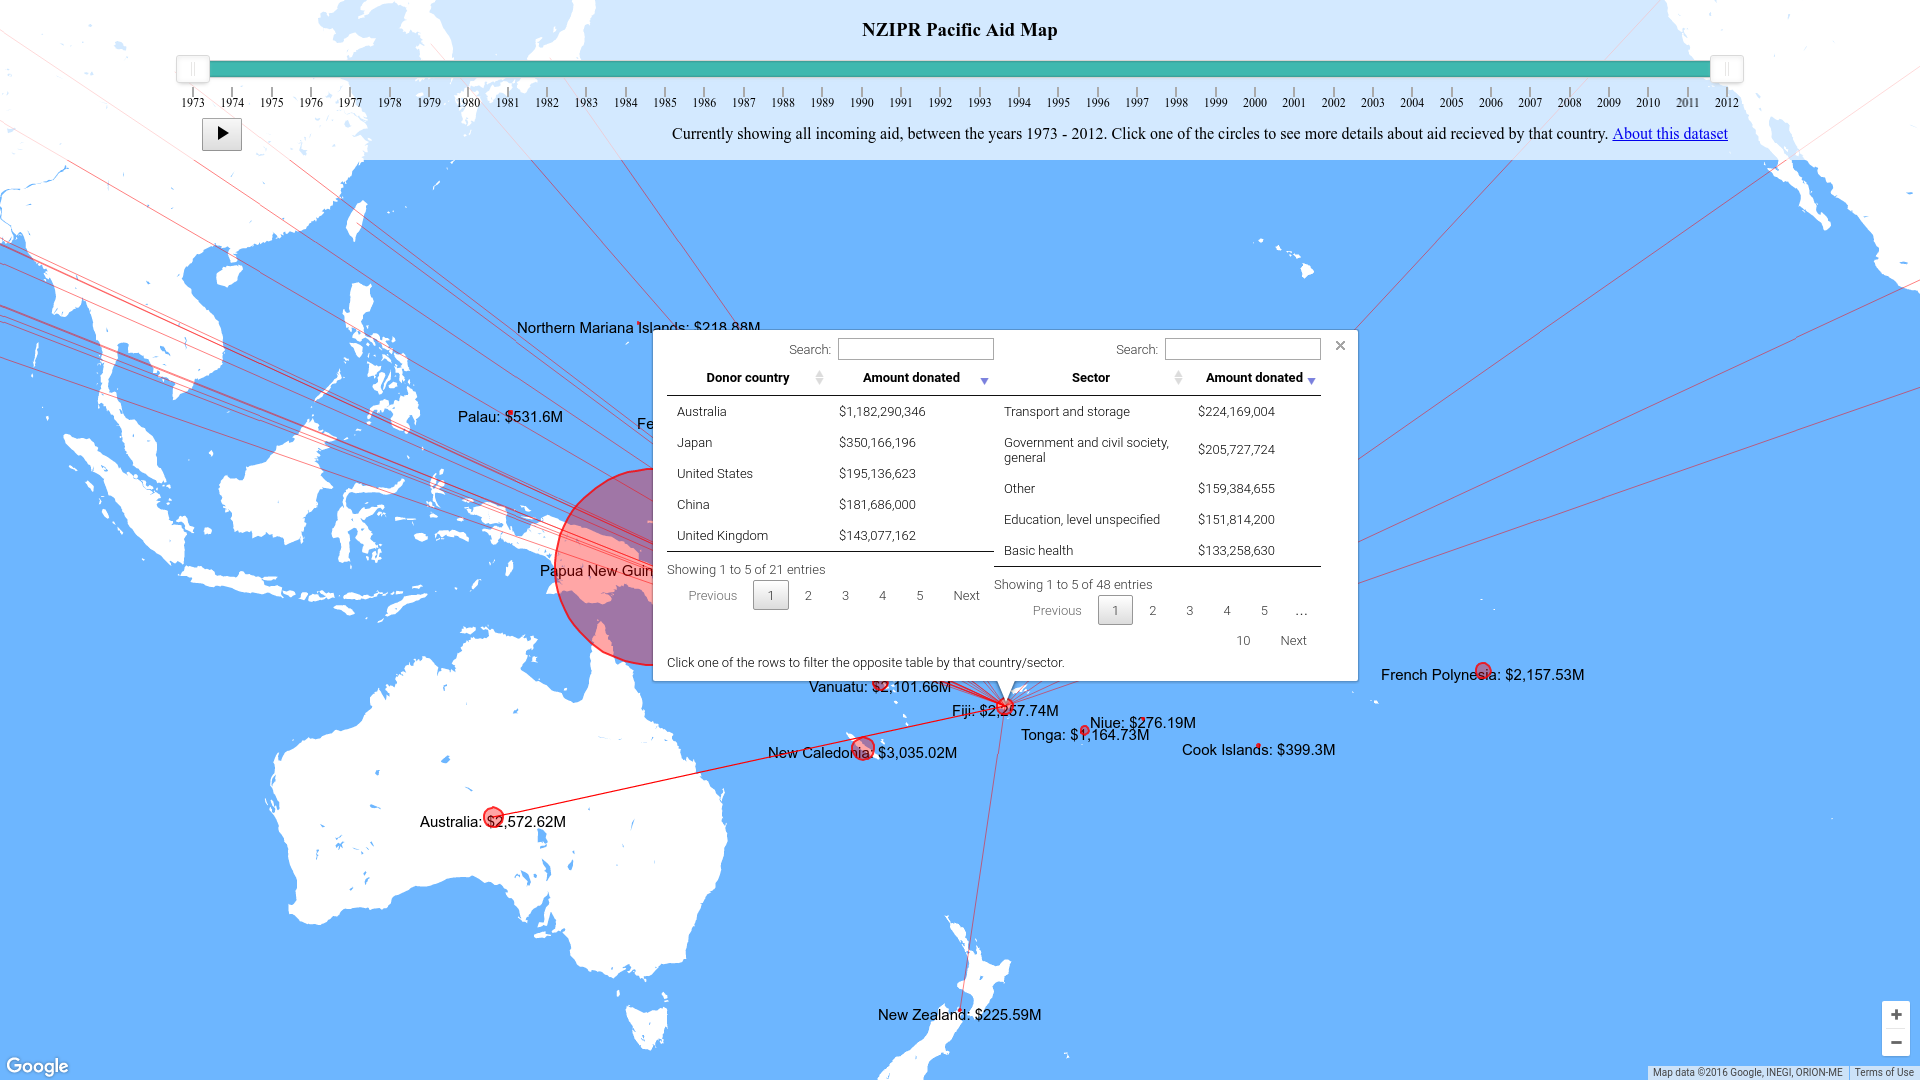
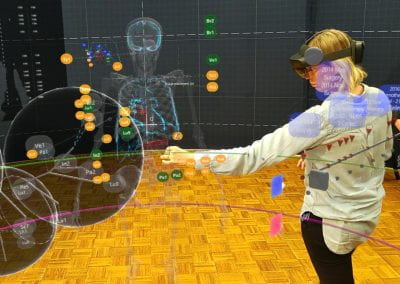
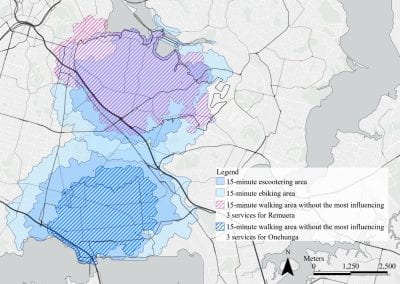
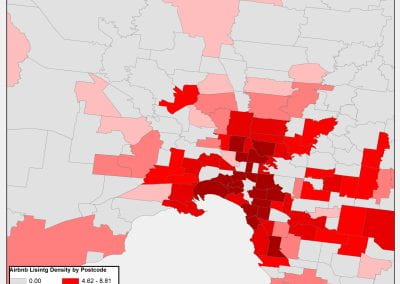
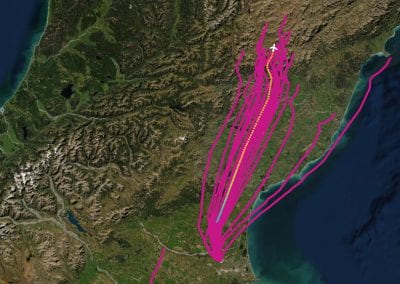
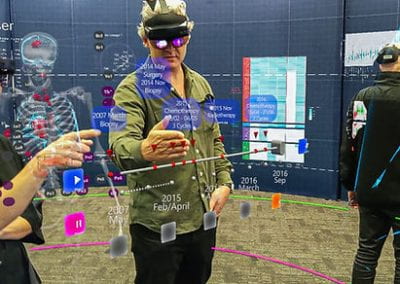
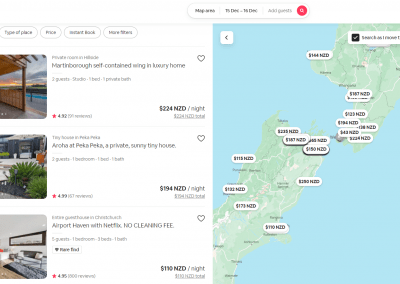
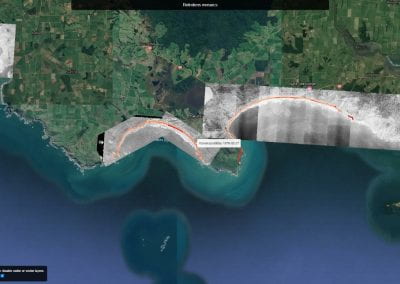
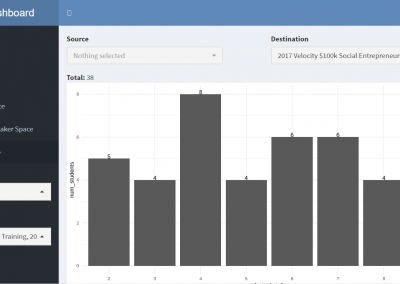
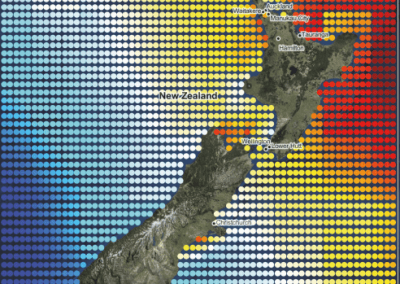
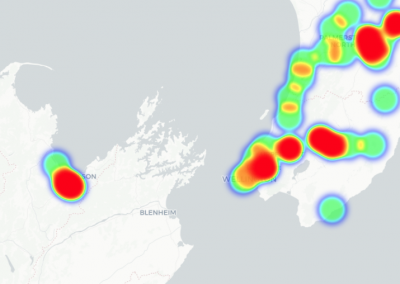
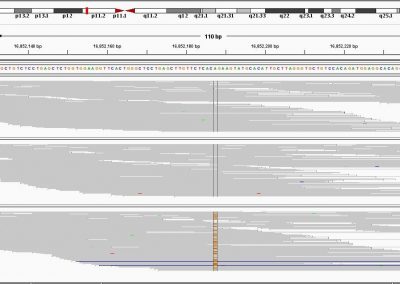
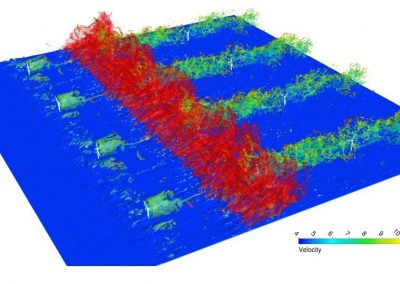
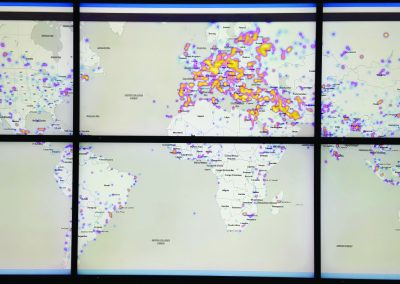
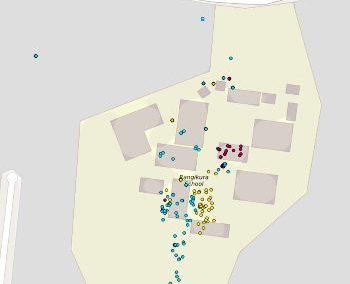
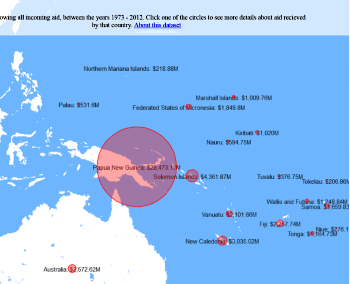
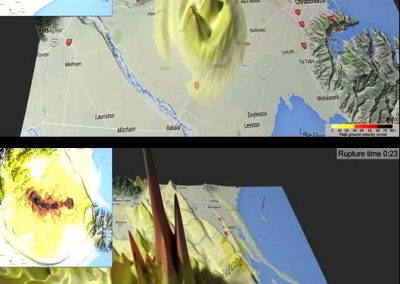
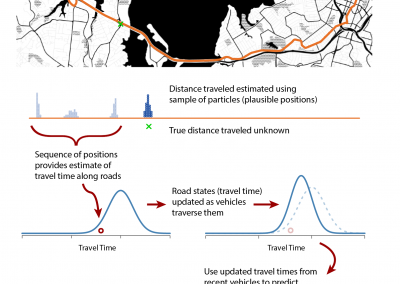
Figure 1. A screen shot of the interactive web application for donor mapping.
Overview
The New Zealand Institute for Pacific Research (NZIPR) is building a dynamic model of donor contributions in the Pacific region. The model will be constructed using data from a number of sources and the results will be displayed on a visualisation tool created by staff at the Centre for eResearch (CeR). The visualisation tool will be accessible from the NZIPR website. The purpose of the visualisation tool, funded by the Ministry of Foreign Affairs and Trade (MFAT), is to provide policy makers, interested members of the public and researchers with a way to: The New Zealand Institute for Pacific Research (NZIPR) is building a dynamic model of donor contributions in the Pacific region. The model will be constructed using data from a number of sources and the results will be displayed on a visualisation tool created by staff at the Centre for eResearch (CeR). The visualisation tool will be accessible from the NZIPR website. The purpose of the visualisation tool, funded by the Ministry of Foreign Affairs and Trade (MFAT), is to provide policy makers, interested members of the public and researchers with a way to:
- visualise the donor aid flows into the Pacific region
- conduct analysis of these aid flows.
Data will be obtained from a broad range of sources including the OECD’s creditor reporting website and other relevant sources of information.
The prototype – developed as proof of concept – has used data from the AidData website (aiddata.org) which is an open data source of international development information. Over time other key economic data such as GDP, GNP, inflation and trade flow information will be added along with important socio-demographic indicators such as life expectancy, population structure, education level, etc. A prototype was presented in August 2016 and signed off by MFAT. The first stage of the project will be completed by December 2017.
How the Centre for eResearch helps with the visualisation and analytics
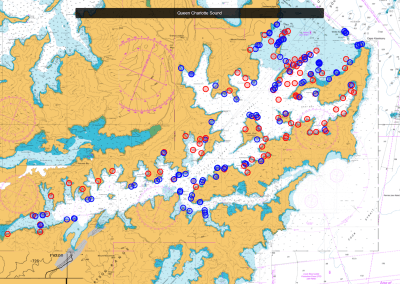
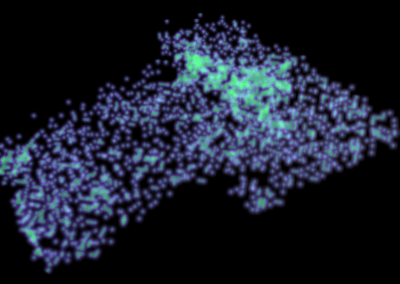
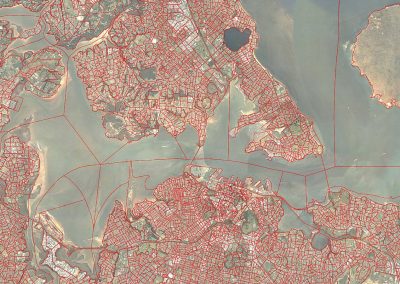
Staff at the Centre for eResearch are building a visual spatial map which includes a 3D version for aid into the Pacific region, and will then help to display these maps interactively on the NZIPR’s website (see Figure 1, an example of screen shot zoom in Solomon Island) with the objective to maximise utility and user-friendliness. The maps are augmented by tables and charts showing the underlying information which can be manipulated or filtered by the user. The database behind the tool needs to be able to be updated with new information as it becomes available. Staff at the Centre for eResearch used a database conversion tool called sqlizer (https://sqlizer.io/) to generate a SQL table definition from the http://aiddata.org/country-level-research-datasets#aiddata-research-release-30 dataset and loaded it into a mysql database.
What’s Next?
The visualisation tool will be developed in several stages. This will enable enhancements to be made to the tool as additional sources of information are obtained, as further means of analysing data are developed and as ways of displaying the data are produced. In addition, a mechanism by which the data behind the visualisation can be easily updated will be developed. At each stage, technical development will be responsive to the requirements of MFAT and the wider development community.