MFT-ICR mass spectrometry data management and analysis workflow
Dr Nicholas Demarais, Research Fellow, School of Biological Sciences
Introduction
Mass spectrometry (MS) is an analytical technique that ionizes chemical species and sorts the ions based on their mass-to-charge ratio (m/z). In addition to the m/z value, the natural abundance of atomic isotopes provides a unique fingerprint for each ion. Fourier transform-ion cyclotron resonance mass spectrometry currently offers the highest resolution, mass accuracy, and sensitivity of all available mass analysers. This allows not only the assignment of an m/z value with high precision and accuracy, but also detection of the fingerprint of each ion even at low abundances. This is achieved by trapping ions in a static magnetic field. The ions travel in a circular motion and the sum of all frequencies of all ions is detected. Finally, this frequency sum is converted to a mass spectrum through a Fourier transform. A Bruker SolarixXR Fourier transform-ion cyclotron resonance (FT-ICR) mass spectrometer is located in the School of Biological Sciences mass spectrometry facility (Science Centre 303-B45). In addition to the advanced mass analyser, the utility of multiple ionization techniques make this instrument amenable to many different types of research in the fields of biology, chemistry, materials, health, and fundamental science. Existing users span both the Faculty of Science and Faculty of Medical and Health Sciences, and the capacity is expected to expand to other researchers within the University of Auckland and across New Zealand. A broad range of users creates issues due to their diverse locations, and the ultra-high resolution experiments can result in large and varied data sets. To overcome these issues, Dr Nicholas Demarais has worked closely with CeR to develop a robust data management plan, and an efficient analysis workflow that incorporates the use of RVM.
Data management plan
Although facility-run services are available for the SolarixXR FT-ICR mass spectrometer, collaborative research projects and researcher engagement are strongly encouraged. This necessitates the need for efficient dissemination of data to researchers across the University. A hierarchical structure centred on a project rather than a student/faculty member enables data from all types of analysis to be stored in one central location. This system reduces the redundancy of data sets stored across many PCs, identifies ownership, and provides access to all relevant persons. A read-only backup is accessible if the original data is ever needed. The workflow is presented in Figure 1.
Data analysis workflow
Once this data is managed and stored properly, the next major bottleneck is data analysis and access to appropriate software tools. The RVM is utilized to house all of the data analysis software packages in one location. With such a diverse user base in discipline and location, the RVM allows researchers to analyse, manipulate, and visualize their data from any computer on campus or externally through the VPN. This utility, combined with the data management system, creates an efficient workflow for mass spectral data analysis that reduces data reduction time, and increases the accessibility of the data (also refer to Figure 1).
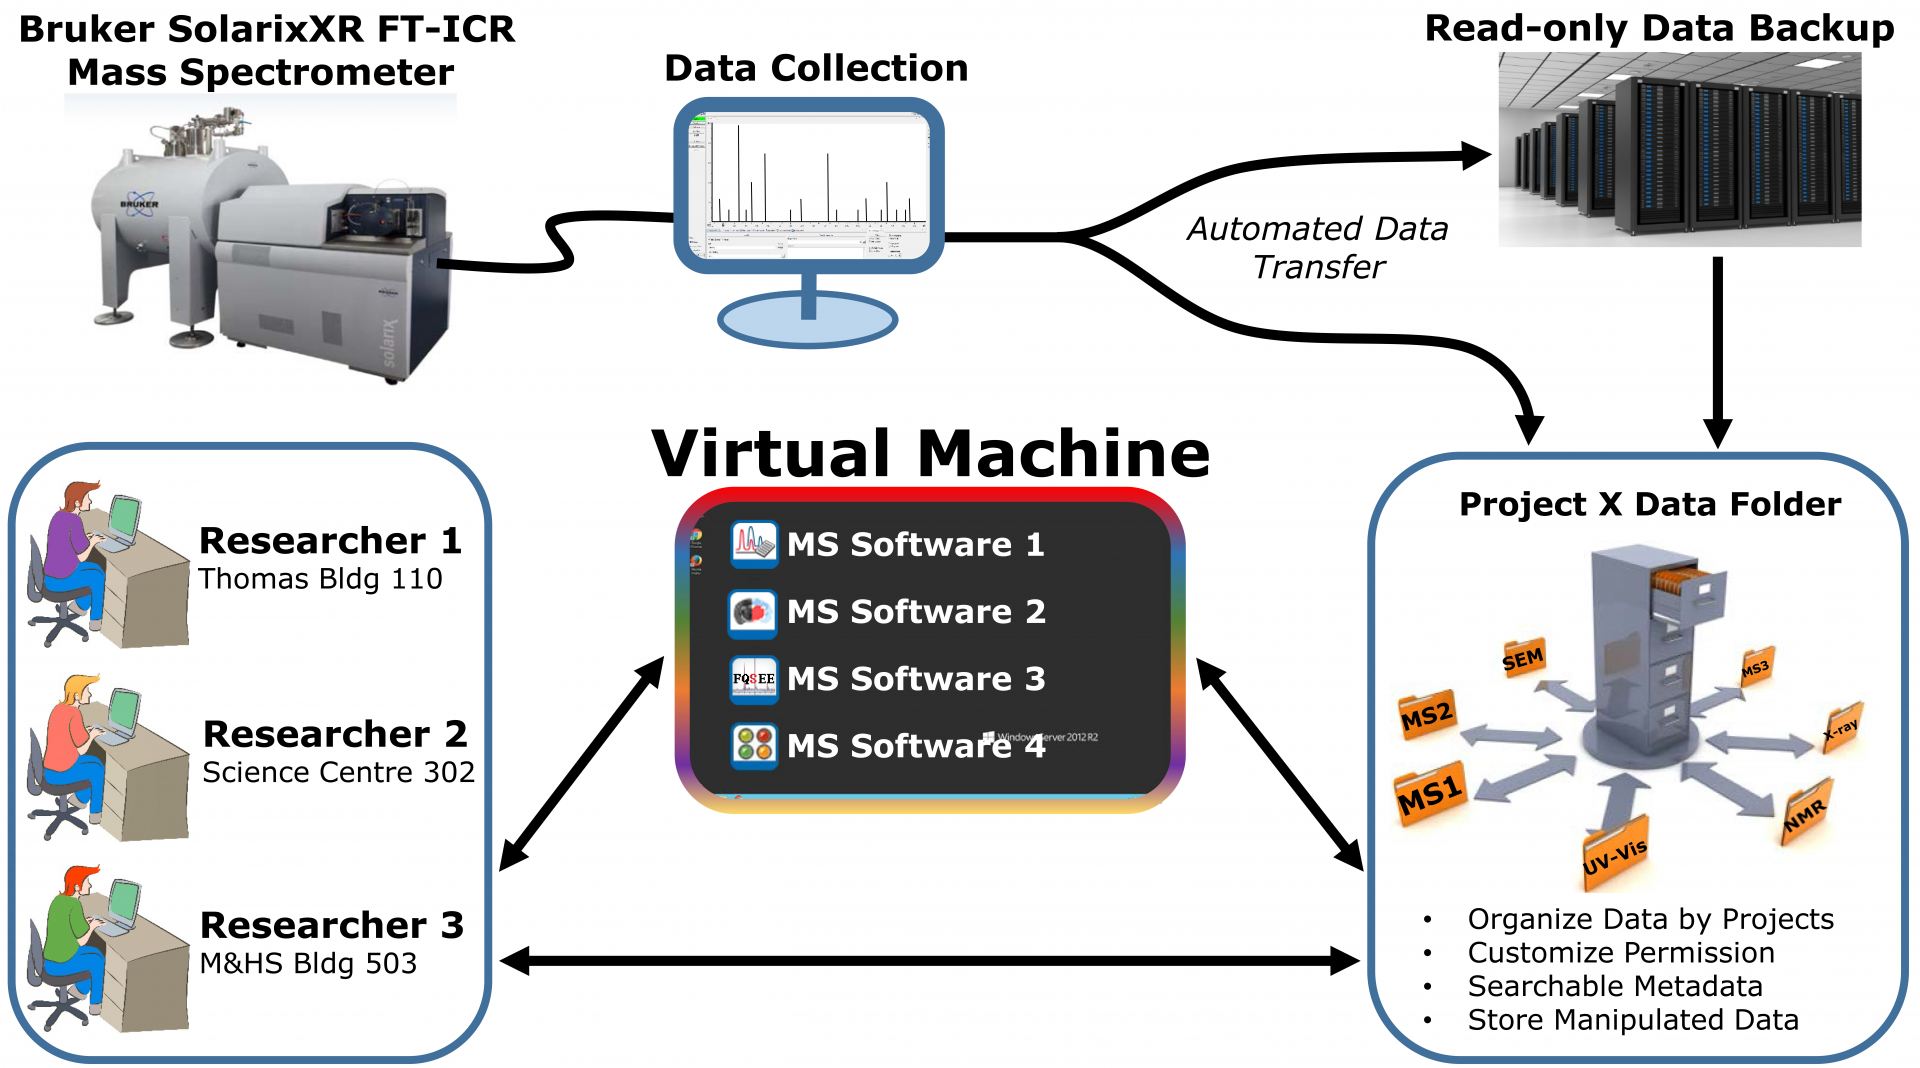
Figure 1. FT-ICR MS data management and analysis workflow. (From Top Left) Mass spectrometry experiments are carried out by researchers and data is collected on a local PC. This data is transferred to the relevant project folder and a backup is stored separately. Researchers with permission to access the project folder and/or mass spectrometry files can interact with the data directly or indirectly through the RVM. This can be done anywhere on campus or externally via access through the VPN. All relevant mass spectrometry software and visualization tools are available on the RVM.
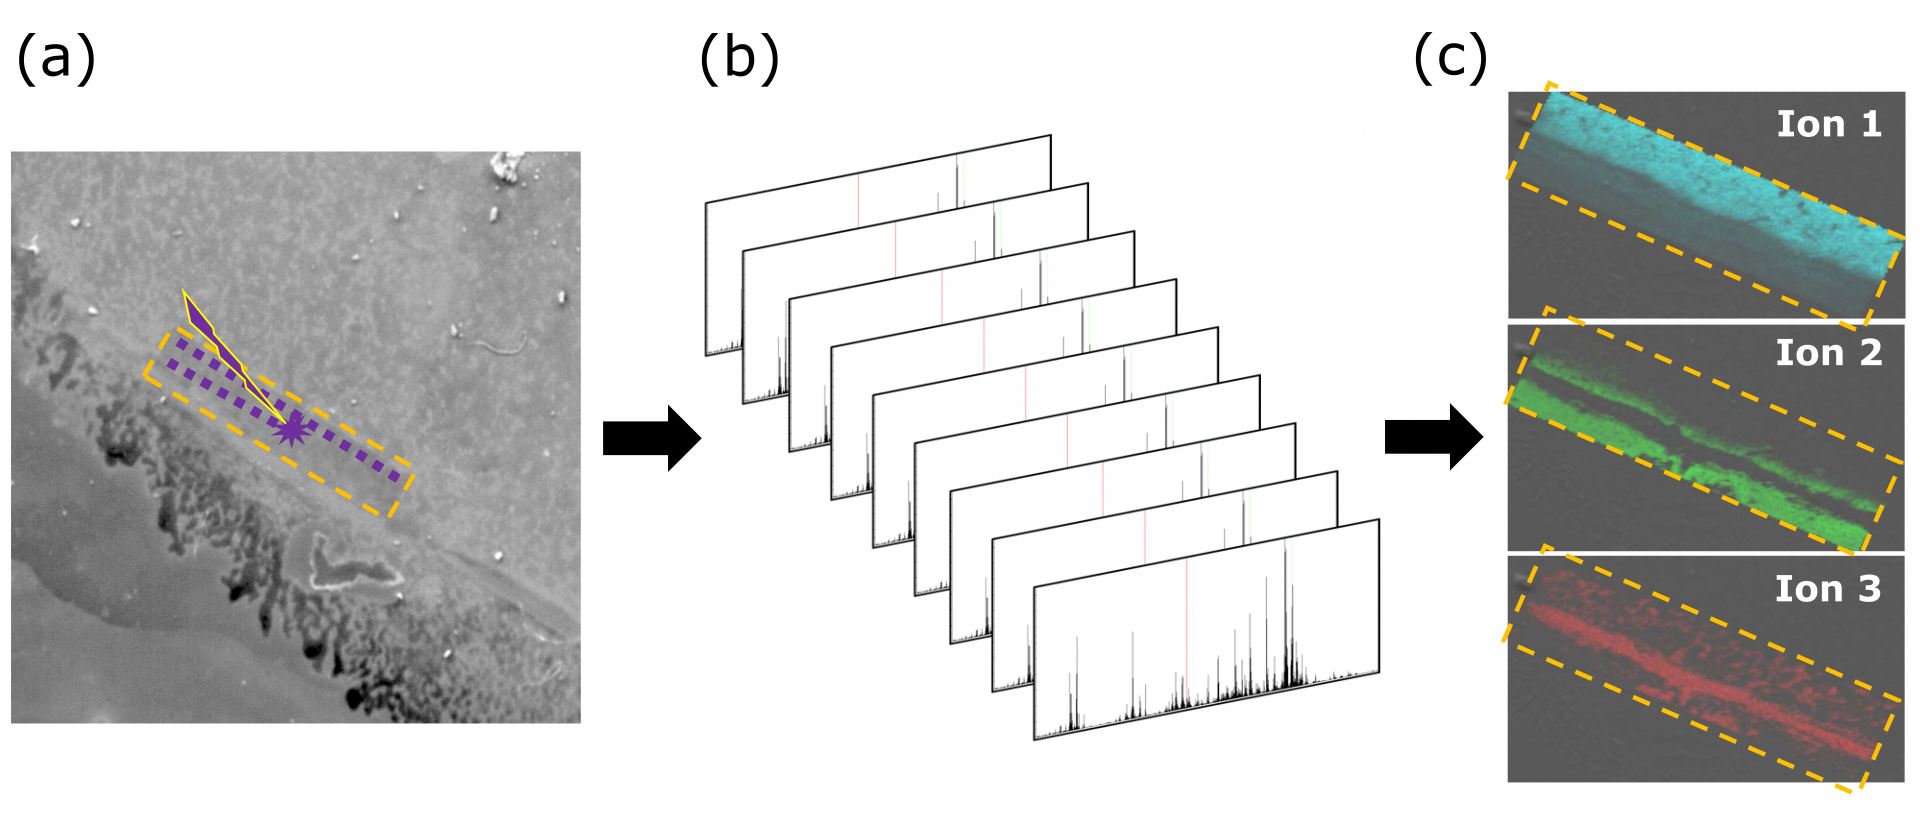
Figure 2. MALDI imaging mass spectrometry workflow. (a) A thin layer sample is placed on a glass slide and coated with a matrix. An area of interest is highlighted (dashed yellow), and scanned by a pulsed laser. (b) One mass spectrum is recorded for each spatial position. (c) The individual mass spectrum are collated to generate a 2-D image, and specific ions of interest are mapped onto the surface (brightness ∝ intensity). Three different special distributions are observed by plotting ions that correlate to three different molecular species.
Data visualization
In addition to increased accessibility and usability, the computing power of the RVM is vital for handling large data sets generated by this ultra-high resolution instrument. One example of such an experiment is matrix assisted laser desorption ionization-imaging mass spectrometry (MALDI-IMS). For this technique, a thin layer sample (e.g. sectioned human eye lens or mouse brain) is placed on a glass slide and coated with a matrix. A pulsed laser is used to generate ions, and a 2-D profile of the surface is collected by scanning the laser across the sample. One mass spectrum is collected at each point (10-200 um spacing), which results in 10,000–1,000,000 individual spectra. The individual mass spectra are then collated to produce a 2-D intensity profile (Figure 2). Typical data sets are 1–100 GB and the power of the RVM, combined with the centralized location of multiple software, allows users to manipulate and visualize their data efficiently.
See more case study projects

Our Voices: using innovative techniques to collect, analyse and amplify the lived experiences of young people in Aotearoa
Painting the brain: multiplexed tissue labelling of human brain tissue to facilitate discoveries in neuroanatomy

Detecting anomalous matches in professional sports: a novel approach using advanced anomaly detection techniques

Benefits of linking routine medical records to the GUiNZ longitudinal birth cohort: Childhood injury predictors
Using a virtual machine-based machine learning algorithm to obtain comprehensive behavioural information in an in vivo Alzheimer’s disease model
Mapping livability: the “15-minute city” concept for car-dependent districts in Auckland, New Zealand
Travelling Heads – Measuring Reproducibility and Repeatability of Magnetic Resonance Imaging in Dementia
Novel Subject-Specific Method of Visualising Group Differences from Multiple DTI Metrics without Averaging

Re-assess urban spaces under COVID-19 impact: sensing Auckland social ‘hotspots’ with mobile location data
Aotearoa New Zealand’s changing coastline – Resilience to Nature’s Challenges (National Science Challenge)
Proteins under a computational microscope: designing in-silico strategies to understand and develop molecular functionalities in Life Sciences and Engineering
Coastal image classification and nalysis based on convolutional neural betworks and pattern recognition
Determinants of translation efficiency in the evolutionarily-divergent protist Trichomonas vaginalis
Measuring impact of entrepreneurship activities on students’ mindset, capabilities and entrepreneurial intentions

Using Zebra Finch data and deep learning classification to identify individual bird calls from audio recordings
Automated measurement of intracranial cerebrospinal fluid volume and outcome after endovascular thrombectomy for ischemic stroke
Using simple models to explore complex dynamics: A case study of macomona liliana (wedge-shell) and nutrient variations
Fully coupled thermo-hydro-mechanical modelling of permeability enhancement by the finite element method
Modelling dual reflux pressure swing adsorption (DR-PSA) units for gas separation in natural gas processing
Molecular phylogenetics uses genetic data to reconstruct the evolutionary history of individuals, populations or species
Wandering around the molecular landscape: embracing virtual reality as a research showcasing outreach and teaching tool


