Modelling of costs of diets by INFORMAS
Dr Stefanie Vandevjvere, Senior Research Fellow, Sally MacKay, PhD candidate, Population Health, Faculty of Medical and Health Science, University of Auckland. Programme modelling and analytics developed by Nick Young, Research IT Specialist, Centre for eResearch, University of Auckland
The background

The study
The International Network for Food and Obesity/NCDs Research, Monitoring and Action Support (INFORMAS), coordinated by the School of Population Health at the University of Auckland, is developing methods to monitor the cost differential between healthy and current, less healthy diets in New Zealand and globally. Many diet scenarios can be constructed using a list of commonly consumed foods to meet nutrient and food-based dietary guidelines (for ‘healthy’ diets) or specified nutrient and food intakes (for ‘current’ diets). By taking into account variations of diet costs, the programme will allow for answering the question for the first time, whether a healthy diet is significantly cheaper or more expensive than the current less healthy diet. If successful, this programme can also be franchised to other countries. This research involves developing a novel programme to model a range of healthy and current diet costs, using different combinations of a selection of commonly consumed foods, determined by a set of constraints for each, and specified food and nutrient intakes.
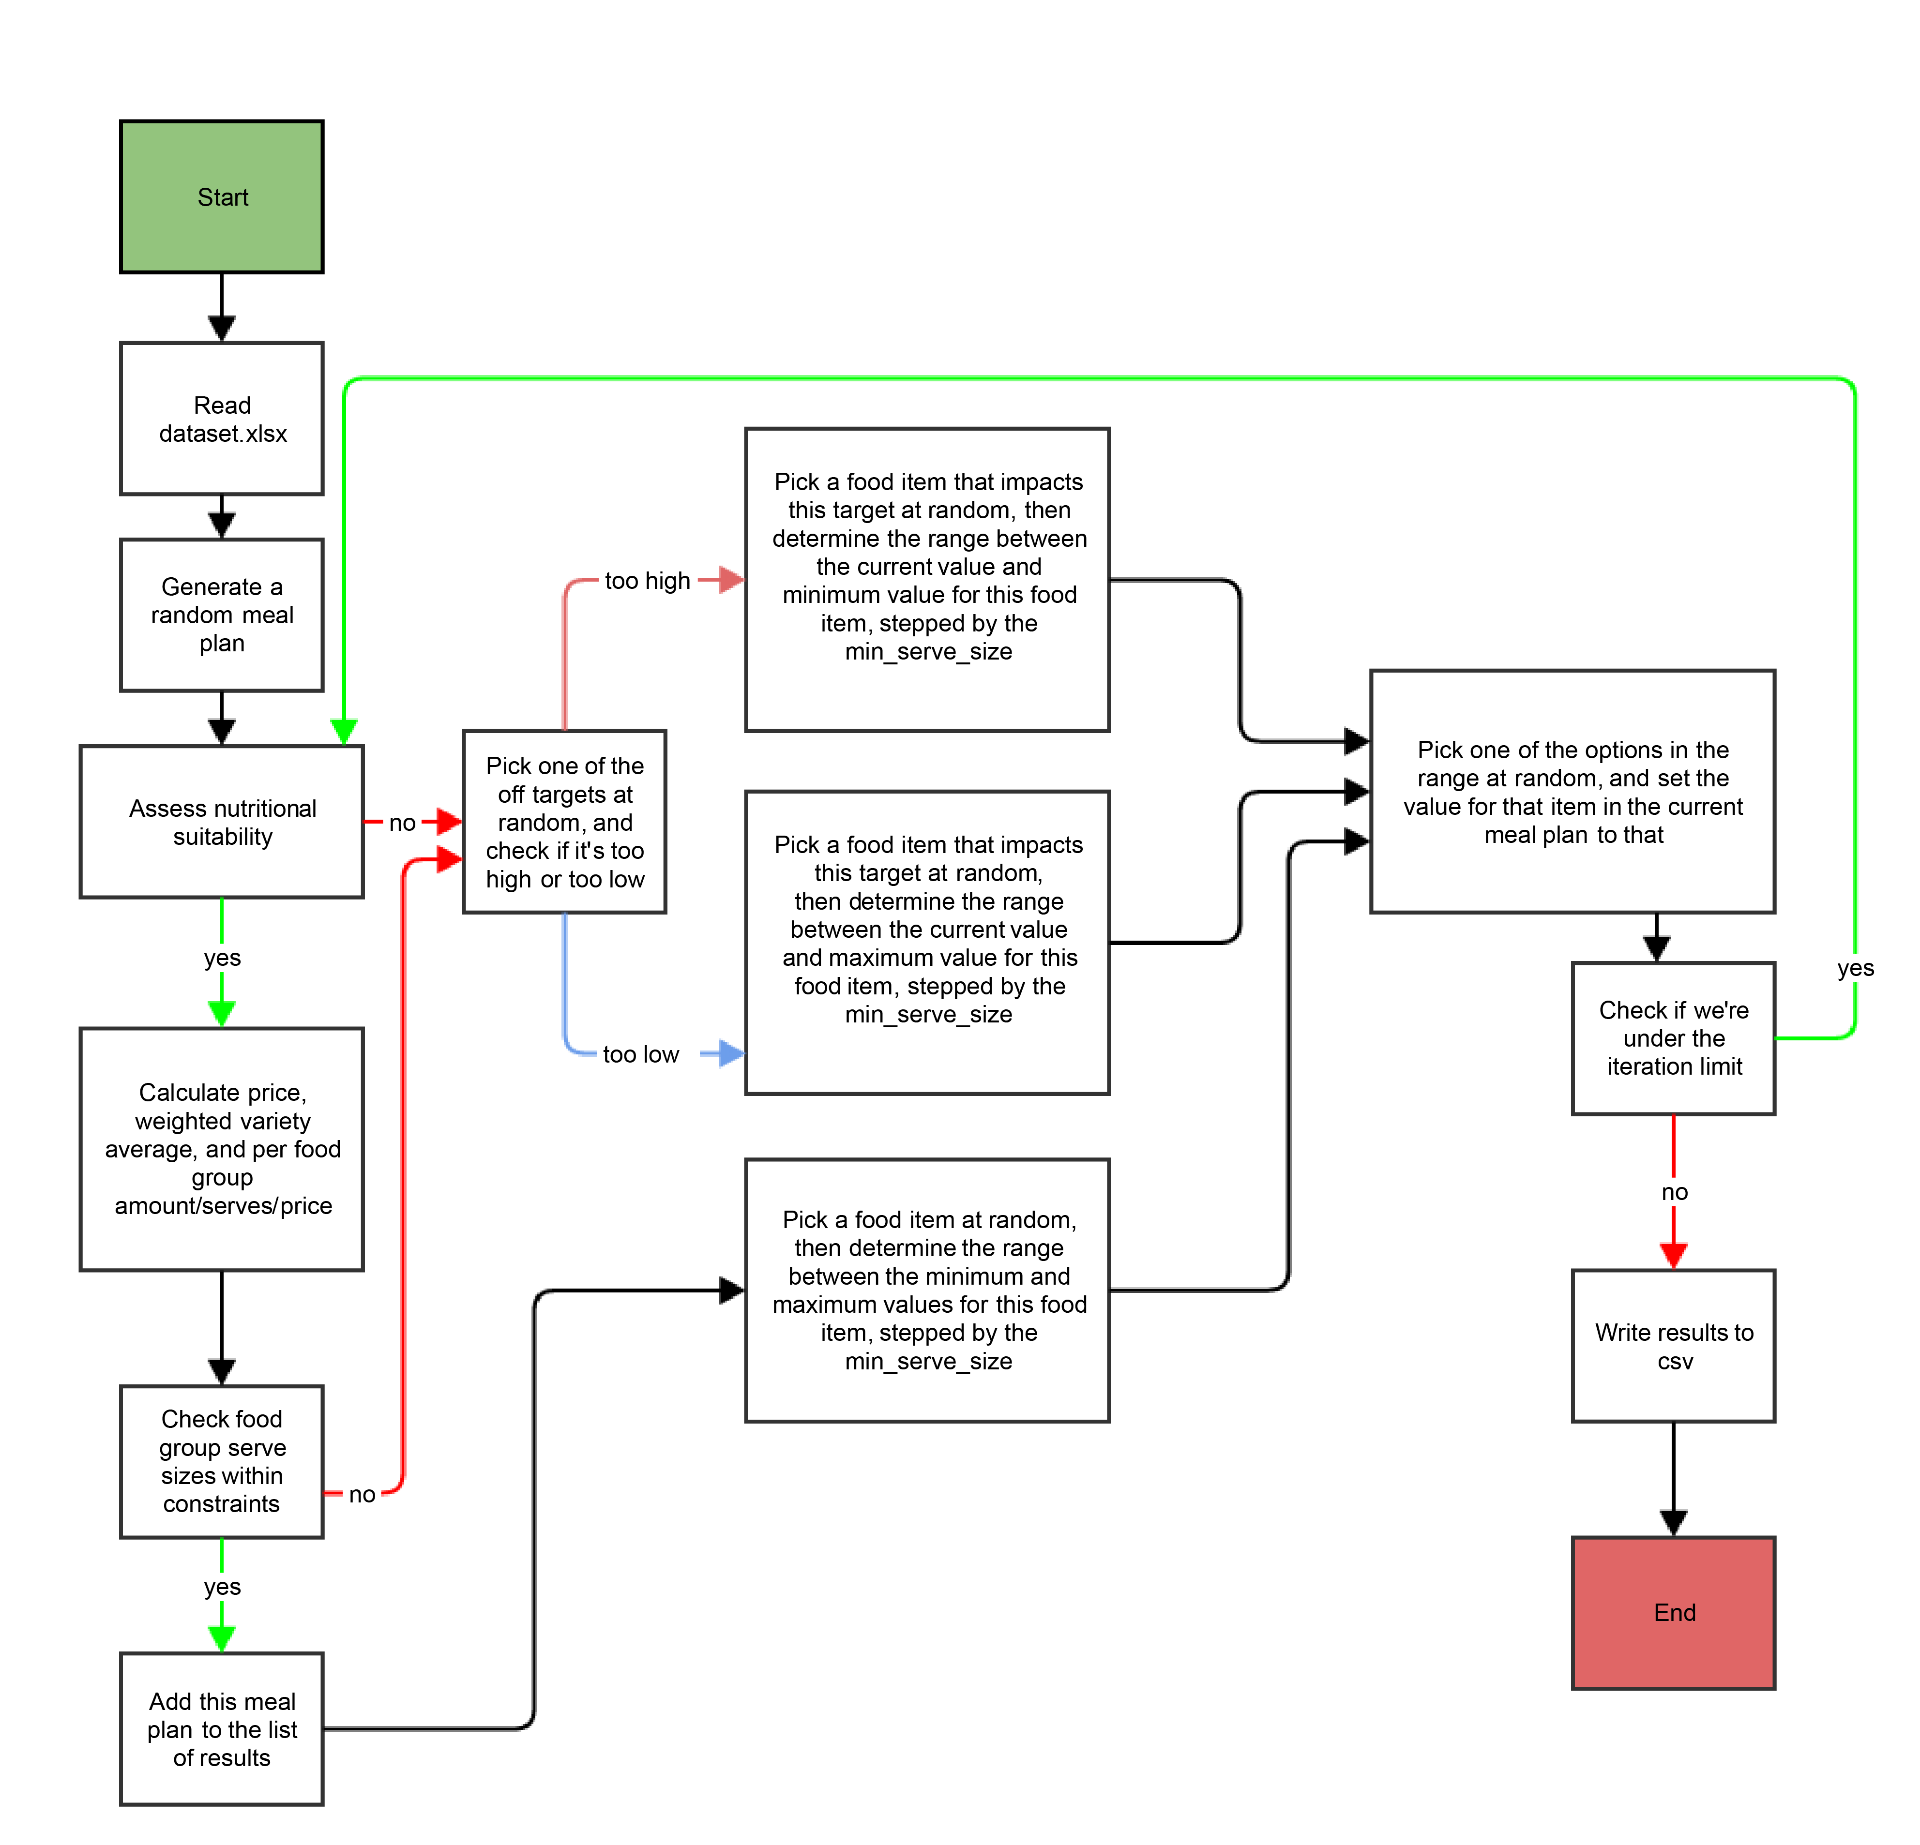
Diagram 1. Shows how the algorithm works.
How the centre helps the researchers to achieve the research objectives
The Centre for eResearch (CeR) has conducted the programming work in two different steps:
- The first step was to derive all the “different” two-weekly menu plans that fit the constraints for the healthy and the current diets (outputs are in the form of household food lists for two weeks). Dataset inputs are the list of commonly consumed foods, nutrient composition database, and for each diet, constraints on nutrients, foods and food groups, for different age and sex groups.
- The second step is to transform “the grams of foods as eaten” into “grams of foods to be purchased” (through using the edible and cooking yield factors) and to take into account price variation for those factors of which data on prices is available (e.g. season, region, supermarket chain, type of outlet, generic/branded price, original/discount price etc.)
CeR is responsible for developing the different iterations of the programme. In addition, a user-friendly interface is being built by the Centre so that the programme can be used by different researchers and potentially by researchers from other countries. The outputs of the programme for the HEALTHY diet and the CURRENT diet are displayed separately. See diagram 1 to show how the algorithm works.
The inputs
A user-friendly interface is being built by the Centre so that the programme can be used by different researchers and potentially by researchers from other countries. There can be options for different scenarios to be simulated using the programme (based on different variables in the data tables). For example, you can adjust the default constraints for the specified persona (see Figure 1) such as the following:
- Nutritional constraints.
- Food group constraints.
- Allowance of discretionary foods in the healthy diet: (yes/no) and the maximum amount (either expressed in gram/litre or in energy).
- Allowance of alcohol in the healthy and current diet: (yes/no) and the maximum amount allowed.
- Possibility to take takeaways out of the current diet (yes/no).
- Possibility to include takeaways in the healthy diet (yes/no).
- Selection of regions to be taken into account (if not all regions).
- Selection of population groups to be taken into account (if not the general population).
- Selection of types of stores to be taken into account (if not only supermarkets).
- Option to only take into account the generic prices.
- Option to only take into account the branded prices. Option to exclude the discounted prices.
- Option to exclude the discounted prices.
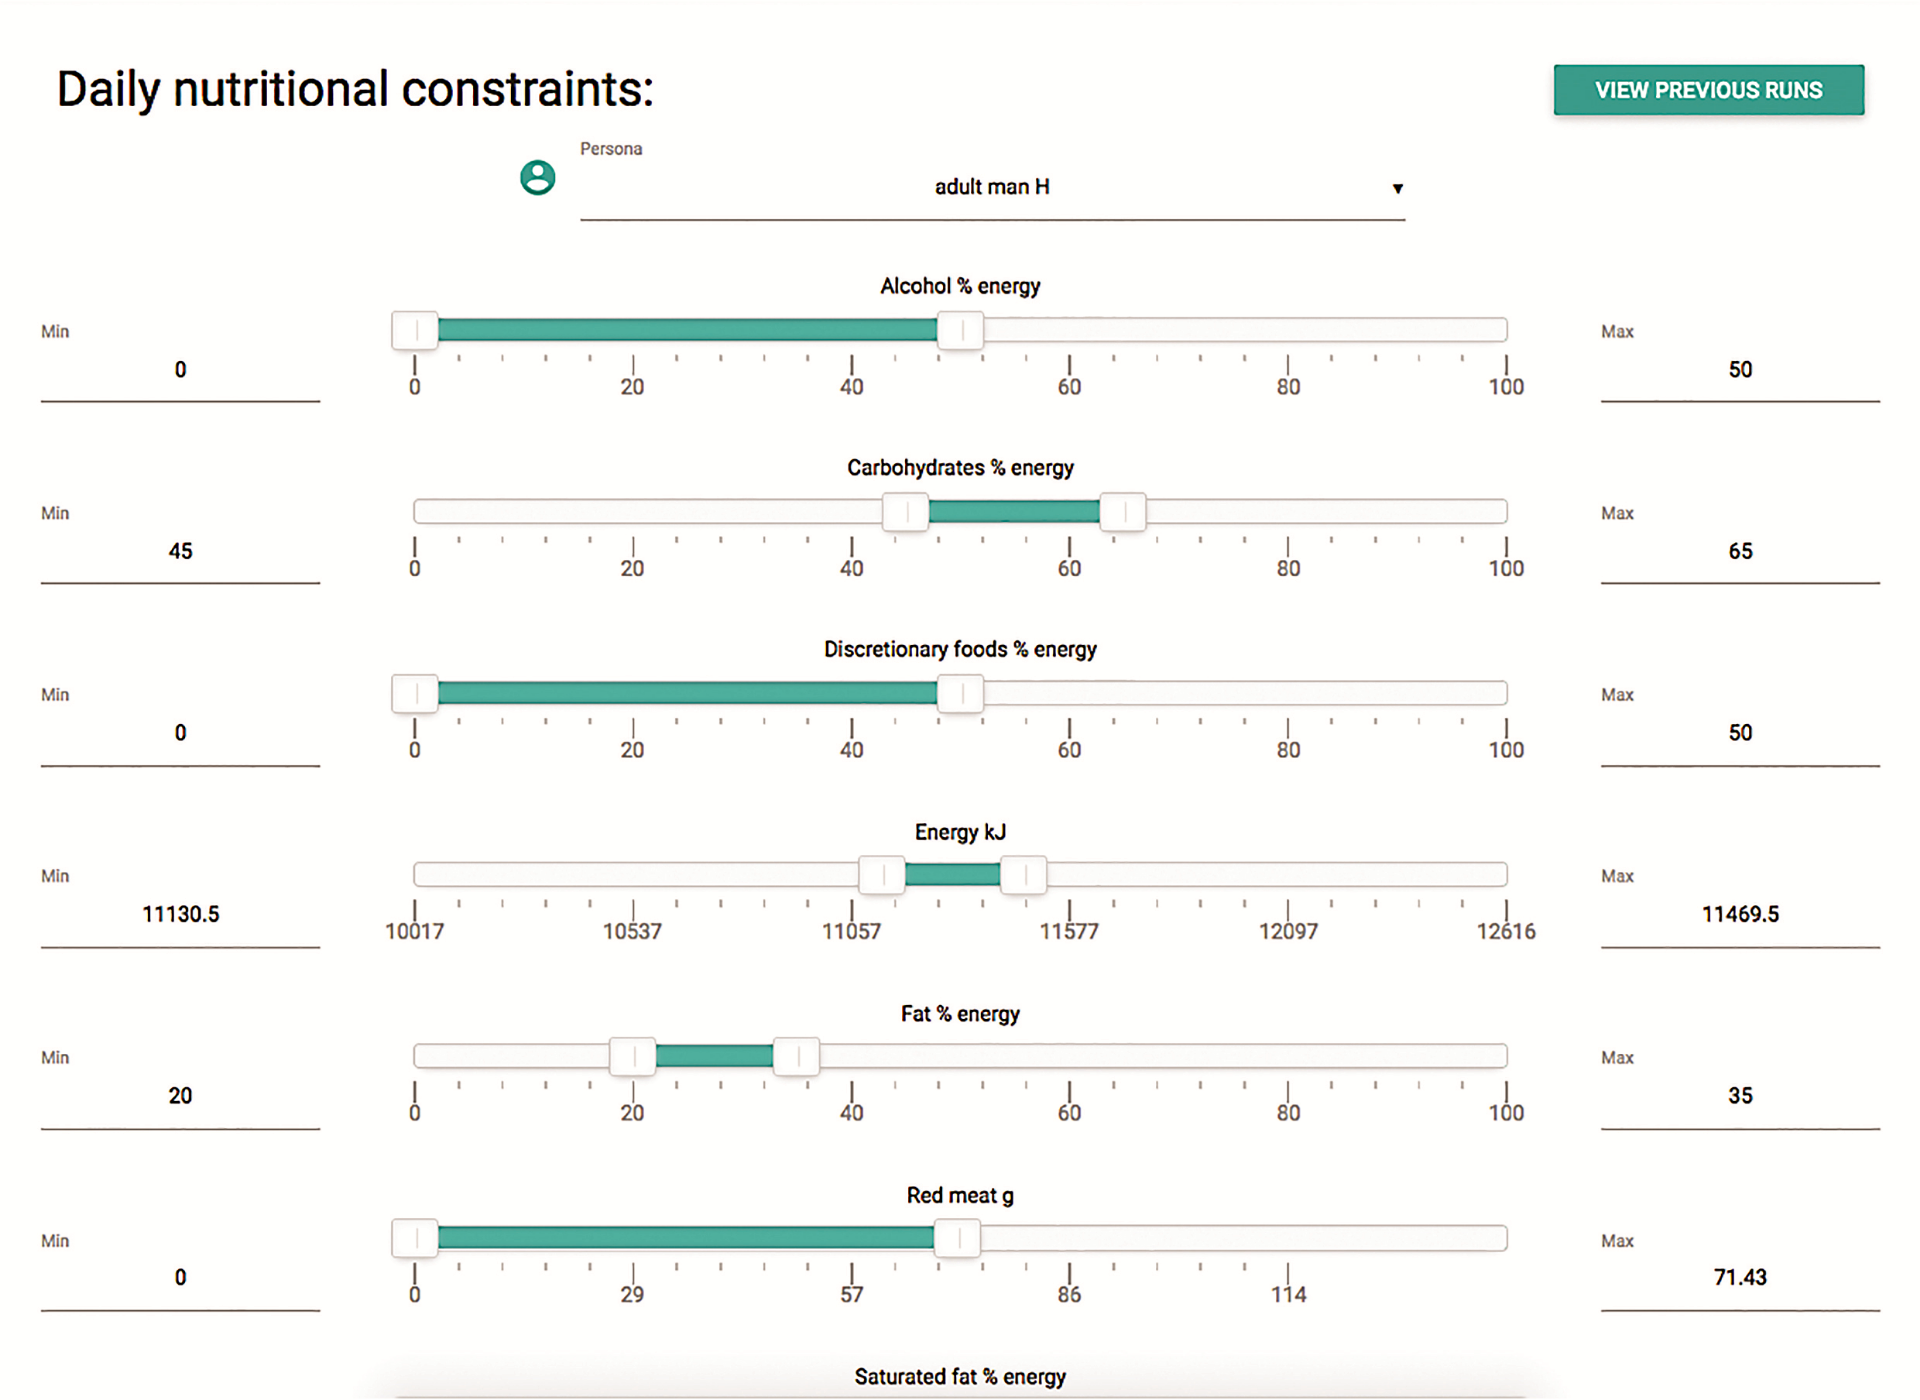
Figure 1. The input
The outputs
The following are the outputs of the programme: (see example Figure 2).
- Total number of different two-weekly menu plans that can be generated based on the input databases and the constraints activated in grams of specific food items per household.
- The average cost of the diet and confidence interval around it.
- The median cost of the diet and inter-quartile range around it.
- % of different food groups contributing to the cost of healthy and current diet.
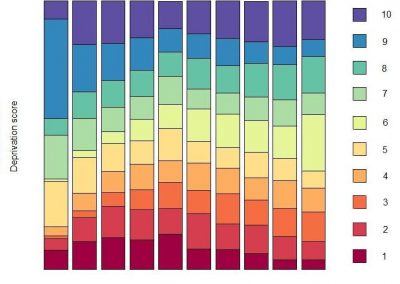
- % contribution of each of the variables (region, deprivation level, type of outlet, supermarket chain, type of price, discounts, variety,…..) to the variation in the cost of the healthy and current diet.
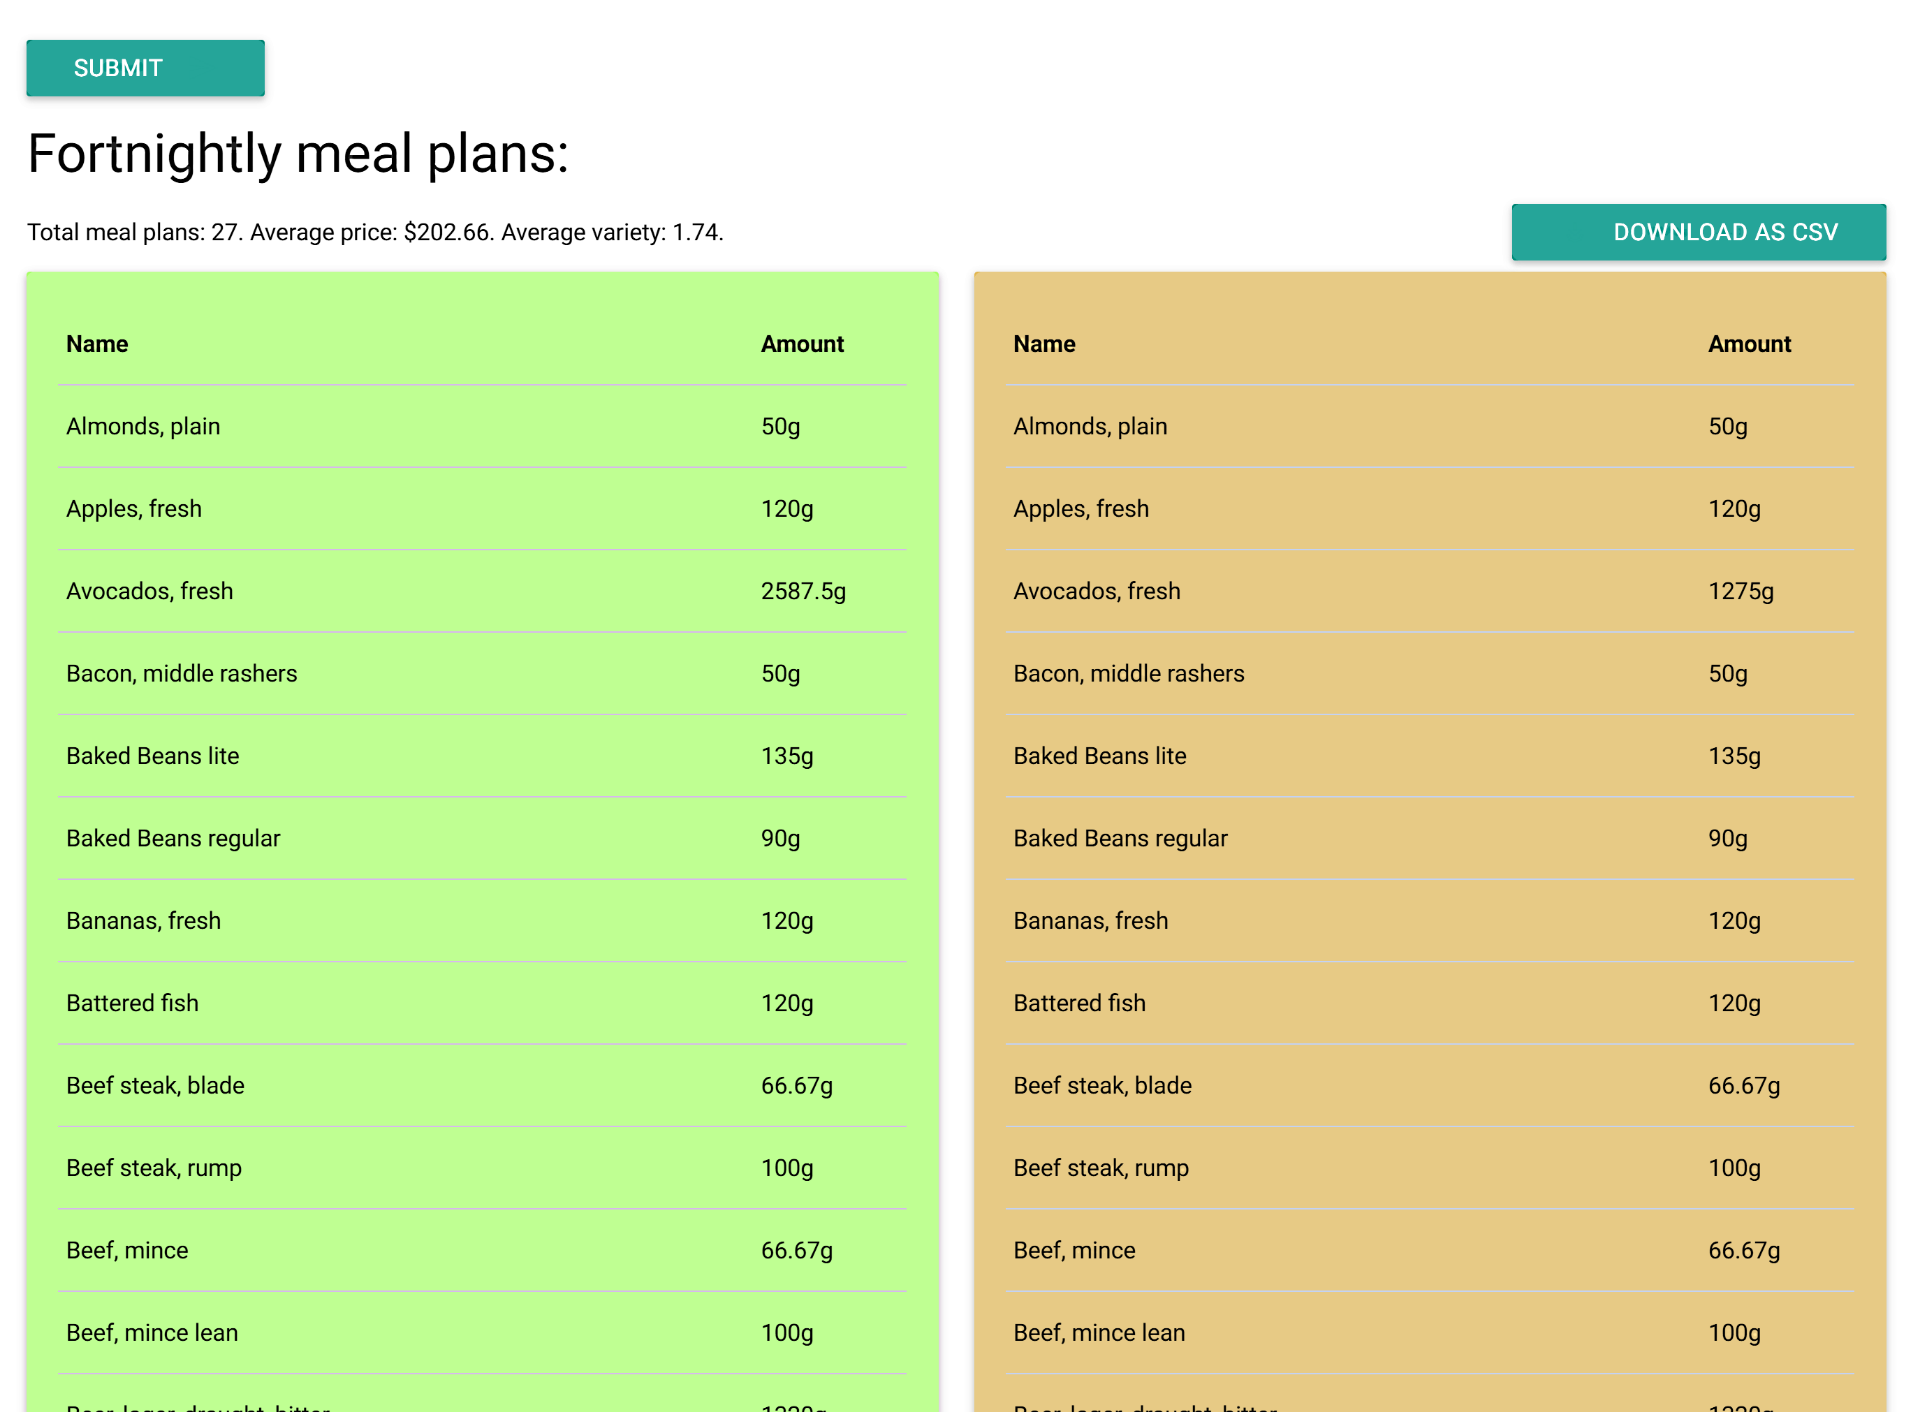
Figure 2. The output
See more case study projects

Our Voices: using innovative techniques to collect, analyse and amplify the lived experiences of young people in Aotearoa

Painting the brain: multiplexed tissue labelling of human brain tissue to facilitate discoveries in neuroanatomy

Detecting anomalous matches in professional sports: a novel approach using advanced anomaly detection techniques

Benefits of linking routine medical records to the GUiNZ longitudinal birth cohort: Childhood injury predictors
Using a virtual machine-based machine learning algorithm to obtain comprehensive behavioural information in an in vivo Alzheimer’s disease model
Mapping livability: the “15-minute city” concept for car-dependent districts in Auckland, New Zealand
Travelling Heads – Measuring Reproducibility and Repeatability of Magnetic Resonance Imaging in Dementia
Novel Subject-Specific Method of Visualising Group Differences from Multiple DTI Metrics without Averaging

Re-assess urban spaces under COVID-19 impact: sensing Auckland social ‘hotspots’ with mobile location data
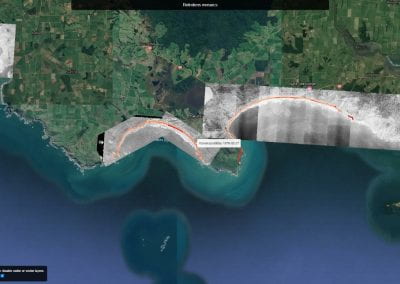
Aotearoa New Zealand’s changing coastline – Resilience to Nature’s Challenges (National Science Challenge)
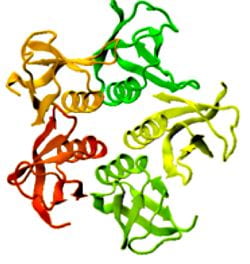
Proteins under a computational microscope: designing in-silico strategies to understand and develop molecular functionalities in Life Sciences and Engineering
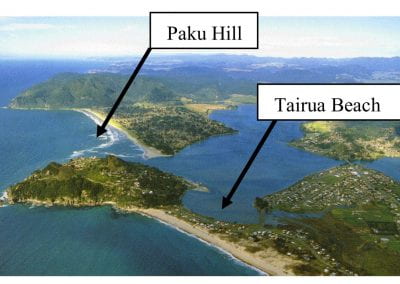
Coastal image classification and nalysis based on convolutional neural betworks and pattern recognition
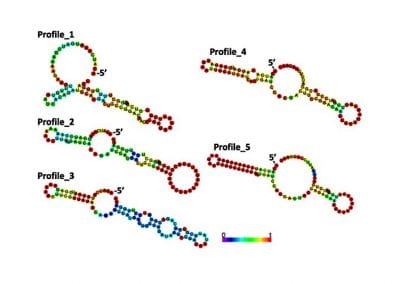
Determinants of translation efficiency in the evolutionarily-divergent protist Trichomonas vaginalis
Measuring impact of entrepreneurship activities on students’ mindset, capabilities and entrepreneurial intentions

Using Zebra Finch data and deep learning classification to identify individual bird calls from audio recordings
Automated measurement of intracranial cerebrospinal fluid volume and outcome after endovascular thrombectomy for ischemic stroke

Using simple models to explore complex dynamics: A case study of macomona liliana (wedge-shell) and nutrient variations
Fully coupled thermo-hydro-mechanical modelling of permeability enhancement by the finite element method
Modelling dual reflux pressure swing adsorption (DR-PSA) units for gas separation in natural gas processing
Molecular phylogenetics uses genetic data to reconstruct the evolutionary history of individuals, populations or species

Wandering around the molecular landscape: embracing virtual reality as a research showcasing outreach and teaching tool


