Molecular phylogenetics uses genetic data to reconstruct the evolutionary history of individuals, populations or species
Stephane Guindon, Department of Statistics
Understanding biological processes generally involves the comparison of various species. Deciphering the origins of a complex organ, such as the human eye for instance, very much relies on the analysis of same organ in other animals. It is through such comparison that the working of this organ can be inferred. This mechanistic approach to understanding biological systems has been, and still is,very successful. Phylogenetic trees depict the evolutionary relationships between species and thus provide a relevant framework to the comparative approach in biology. Phylogenetic trees are therefore much more than a tool to classify species.
Genetic sequences convey a wealth of information about evolution. Differences between contemporary sequences are the consequence of the accumulation of mutations during the course of evolution. Using a relevant statistical approach, one can then reconstruct the tree that best explains the observed differences between sequences. More specifically, mutations are modeled as a Markov process that “runs along’’ the phylogeny. The inference then relies on the likelihood function, i.e., the probability of observing the sequences at the tips of the tree given the whole phylogenetic model, i.e. the Markov model of mutations as well as the phylogenetic tree itself.
Estimating the parameters of phylogenetic models is challenging. First, the number of possible binary trees that connect the species (or populations) grows exponentially with the number of tips. In practice, when reconstructing phylogenies, it is therefore impossible to examine all possible trees. Heuristic algorithms have thus to be designed in order to explore the space of possible solutions efficiently. Second, as the size of available data sets increases, Markov models of increasing complexity can be fitted to genetic sequences. Estimating the parameters of these models then relies on sophisticated optimization or sampling techniques.
The PhyML software
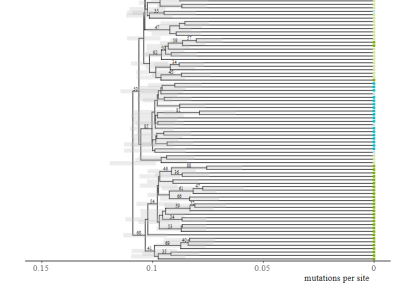
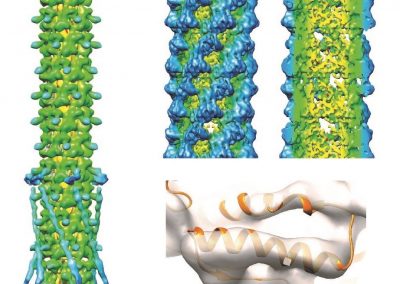
In collaboration with colleagues from the CNRS in France, I have developed the software PhyML that implements fast algorithms for estimating trees that maximize the likelihood function. The original article that describes these algorithms [1] has been widely cited and PhyML is now one of the most popular software in evolutionary biology. The maintenance and development of this software requires constant testing. New methods and algorithms are regularly incorporated in PhyML. Assessing the stability and the performance of these new methods before making them available to the scientific community is therefore paramount.
Given the increasing size of data sets available, the NeSI Pan cluster allows me to run thorough tests by analyzing hundreds, sometimes thousands of sequence alignments in parallel. Being able to monitor the average speed and accuracy with which phylogenetic models are inferred with PhyML is essential in order to make sure this software performs well compared to its multiple competitors.
Modelling competition between species
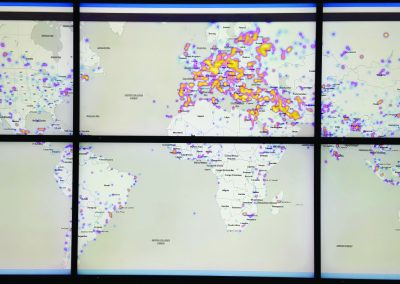
PhyML also serves as a platform to implement research projects. Together with Louis Ranjard (SBS) and David Welch (Department of Computer Science), we have recently designed a statistical model that uses phylogenetics in order to explain the current spatial distribution of species [2]. In particular, our model relies on the idea that a given species may be found at a particular location simply because it happened to be the first to colonize this territory during the course of evolution. In other words, competition between species may prevent secondary colonization.
Using phylogenetics helps us decipher the ordering in which different species colonized their habitat, therefore providing precious indication about whether or not competition could indeed have played a role in this process.
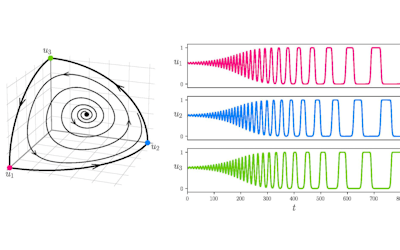
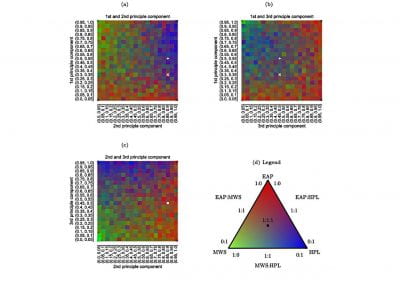
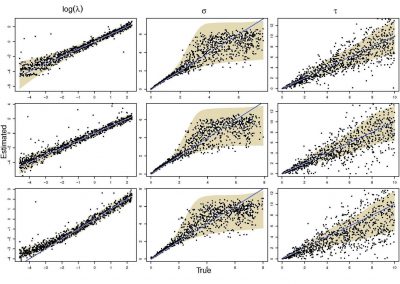
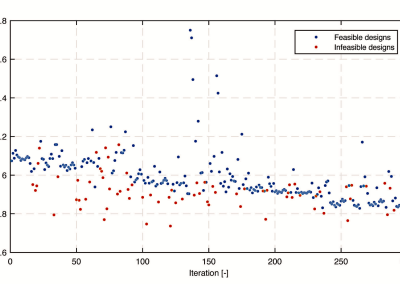
An important aspect in statistical modeling of stochastic processes is to assess the accuracy and precision with which the parameters of these models can be estimated. Large scale in silico experiments are here very helpful. One first generates data according to the proposed model, using specific (or randomly chosen) values for its parameters. The second stage of the experiment consists in using these simulated data and infer the model parameters. Ideally, the estimated values and the ‘true’ ones (i.e., the values that were used in the first stage of the experiment) should be highly correlated.
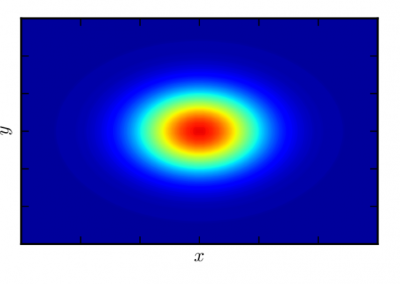
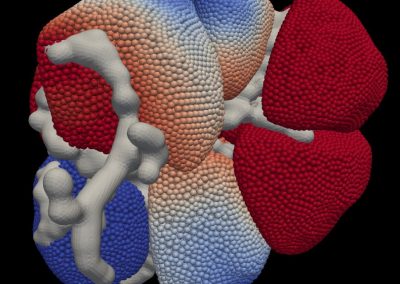
The NeSI Pan cluster provided us with adequate computing resource to perform these experiments for our competition model. We were thus able to show that the parameters of our model can indeed be recovered from the available data (see Figure 1), hence demonstrating the validity of our approach.
Each data point in these scatterplots was obtained from the Bayesian estimation of the corresponding parameters using Markov Chain Monte Carlo. These inference techniques enjoy good statistical properties but are very demanding from a computational perspective. We would simply not have able been able to produce these results without the computing resources provided by the NeSI Pan cluster.
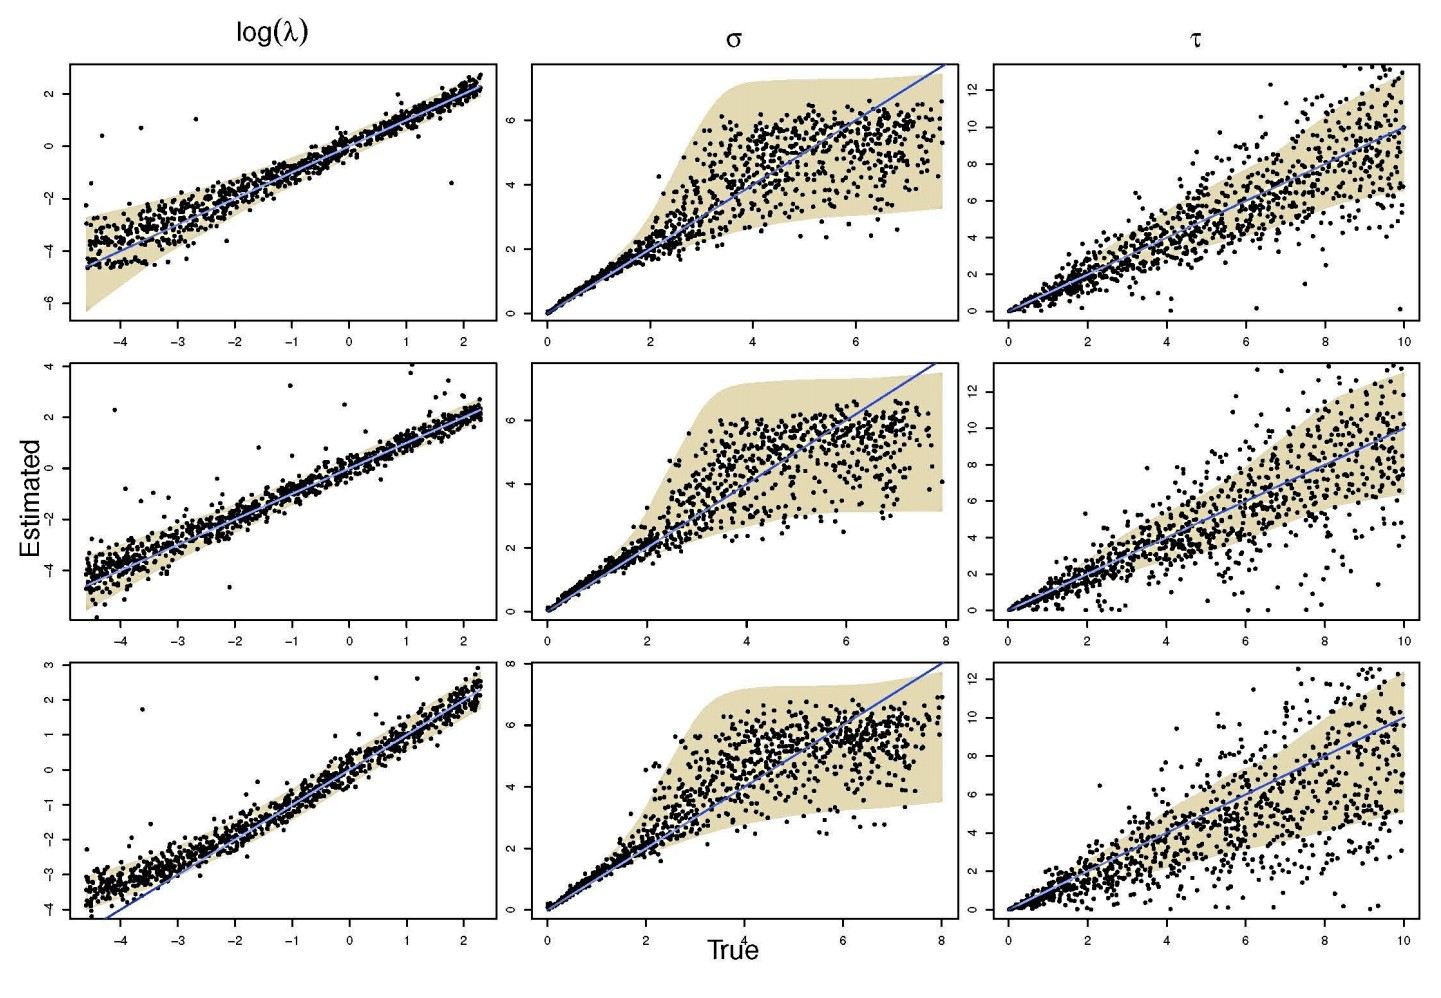
Figure 1: Posterior estimates of competition (λάμδα) and dispersal (σίγμα και ταυ) parameters — 100 taxa, 150 locations (top row), 100 locations (middle) and 50 locations (bottom).
References
- A simple, fast, and accurate algorithm to estimate large phylogenies by maximum likelihood S Guindon, O Gascuel Systematic Biology (2003) 52 (5): 696-704.
- Modelling competition and dispersal in a statistical phylogeographic framework L Ranjard, D Welch, M Paturel, G Stephane Systematic Biology (2014) 63 (5): 743-752.