Novel Subject-Specific Method of Visualising Group Differences from Multiple DTI Metrics without Averaging
Eryn E Kwon1,2,3, Maryam Tayebi1,3, Joshua McGeown1,2, Matthew McDonald1,2, Patrick McHugh1,4, Paul Condron1,2, LeighPotter1,5, Davidson Taylor1,6, Jerome Maller7, Miao Qiao8, Alan Wang1,2,3, Poul Nielsen3,8, Justin Fernandez1,3,8, Miriam Scadeng1,2, Samantha Holdsworth1,2, and Vickie Shim1,3.
1 Mātai Medical Research Institute, Tairāwhiti/Gisborne, 2 Faculty of Medical and Health Sciences & Centre for Brain Research, University of Auckland, 3 Auckland Bioengineering Institute, University of Auckland,4 Tūranga Health, Tūranganui-a-kiwa, Tairāwhiti/Gisborne, New Zealand, 5 Ngāti Porou, Ngāti Kahungunu, Rongomaiwahine, Rongowhakaata, Tairāwhiti/Gisborne,
6 Ngai Tāmanuhiri, Rongowhakaata, Ngāti Porou, Tairāwhiti/Gisborne, New Zealand, 7 General Electric Healthcare, Victoria, Australia, 8 Department of Engineering Science, Faculty of Engineering, University of Auckland.
Synopsis
Averaging is commonly used for data reduction/aggregation to summarise such high-dimensional data, resulting in information loss. However, individual variability makes group-wise comparisons difficult without data reduction/aggregation. To address these issues, we developed a novel technique that integrates diffusion tensor (DTI) metrics along the whole volumes of the Fibre bundle using a mesh-fitting technique. Using the right Corticospinal Tract (rCST) as an example, we demonstrate the utility of the method in detecting differences in DTI metrics of contact-sports and non-contact-sports athletes.
Introduction
Diffusion tensor MRI (DTI) generates four metrics (fractional anisotropy [FA], axial diffusivity [AD], radial diffusivity [RD], and mean diffusivity [MD]) per voxel, providing microstructural information about tissue. Averaging is commonly used for data reduction/aggregation to summarise such high-dimensional data, resulting in information loss. However, individual variability makes group-wise comparisons difficult without data reduction/aggregation. To address these issues, we developed a novel technique that integrates diffusion metrics along the whole volumes of the fibre bundle using a mesh-fitting technique. Since the right Corticospinal Tract (rCST) is known to be sensitive to brain injury (1), the utility of the method in detecting the differences in DTI metrics of contact-sports and non-contact-sports athletes is demonstrated using rCST.
Method
Participant information:
Under ethics approval, a cohort of contact-sports players (case, n=18) was imaged at 2 timepoints: preseason and postseason. Healthy non-contact-sports athletes from a matching demographic were imaged (control, n=9). Both cohorts were between 16-18 years old. Those with a history of severe brain injury or other neurological conditions were excluded.
Image Acquisition:
T1-weighted and DTI images (Table 1) were acquired on a 3T MRI scanner (SIGNA Premier; General Electric Healthcare, Milwaukee, WI; AIR™ 48-channel head coil).
DTI processing:
Image processing steps were performed using FSL (FMRIB software library) (http://fsl.fmrib.ox.ac.uk/fsl/, version 6.0) (2, 3, 4). Diffusion images were processed using FDT (5).
An output with susceptibility-induced off-resonance field measure (3, 6), was passed onto the eddy tool, which corrects eddy-current induced distortions and subject movements (7). DTIFIT was used to generate the FA, MD, AD, and RD. To segment the rCST, linear registration (using FLIRT tool and MNI152_T1_1mm_brain atlas image (8) followed by a nonlinear registration (FNIRT) (9) was performed on T1-weighted images. Using the JHU ICBM-DTI-81 white-matter labels atlas (10-12), the rCST from the template space was wrapped back into T1-weighted native space. The diffusion metrics were extracted through rigid registration of the segmented rCST on the 3D tensor maps.
Embedding diffusion metrics in a 3D mesh via nonlinear morphing:
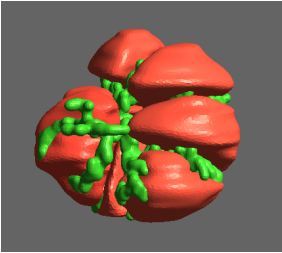
A high-fidelity 3D mesh template of the rCST comprising of hexahedral elements was developed from T1-weighted MRI. This template mesh was used to generate subject-specific meshes of rCST via Freeform deformation (FFD) of the template mesh onto the subject geometry. For each subject, the nodes on the external surfaces of the rCST template mesh were fitted to the geometry data points from the MRI segmentation while the internal nodes were transformed using the same deformation as the external nodes, preserving the relative nodal positions within the mesh (Figure 1).
This fitting method has been extensively used in subject-specific finite element model generation for the brain (13, 14), knee, hip, and ankle joints (15-17). After the fitting, the nearest voxel in the MRI space to each element was located using the nearest neighbour search algorithm in Python (Scipy cKDTree) (13, 14). The average diffusion metrics value from the 9 nearest voxels were stored as field information for each node. Due to the use of common template mesh, the dimensionality of the DTI metric information is matched for all subjects, which is essential in performing the principal component analysis (PCA) step below.
Principal Component Analysis (PCA):
The pcaMethods library from R statistical software (version 4.1.2) was used to perform PCA. The normalised and scaled values of FA, MD, AD, and RD from each element (total n=20,480) of the fitted mesh were used to generate independent, linear combinations for each individual. Plots of PCA components 1 and 2 were then used to visualise clustering of cases vs. controls, based on the individual variance in the rCST.

Table 1: Acquisition parameters for the T1- weighted and diffusion tensor (DTI) sequence.
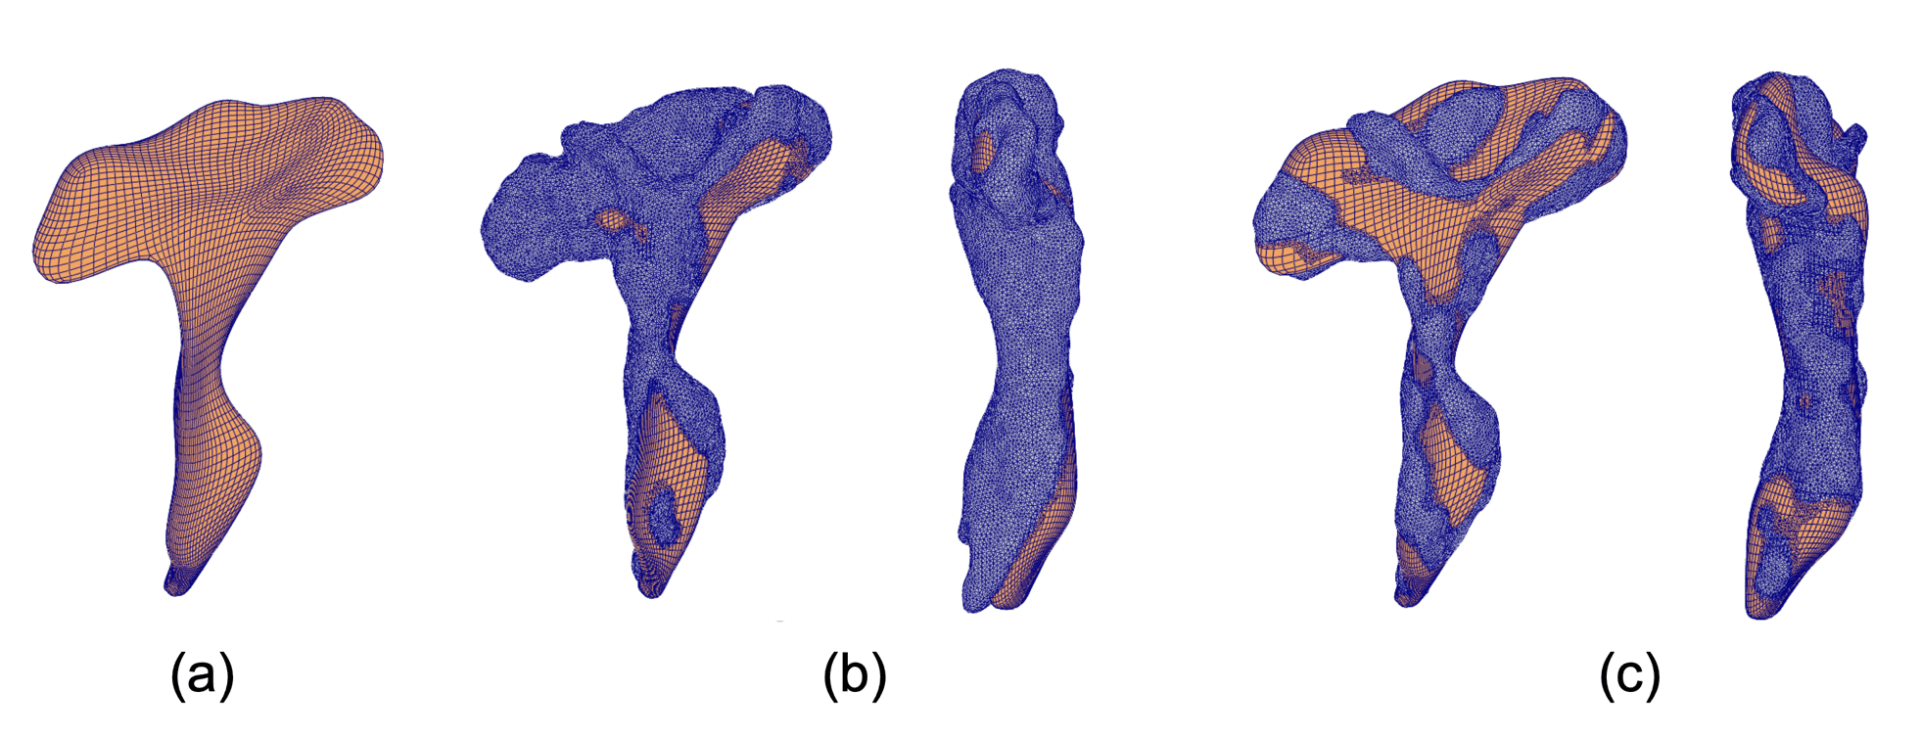
Figure 1: How subject-specific mesh fitting is performed. Free form deformation process that morphs a template mesh to a new subject’s geometry. (a) Template mesh created from a subject to roughly resemble the generic shape of the rCST. (b) 20,480 squares are overlaid on each specific subject’s geometry. Since the match is not optimized for each subject, the template mesh is deformed to minimize the rms error. (c) The optimized subject-specific fitted mesh. Both coronal and sagittal view are shown for (b) and (c).
Results
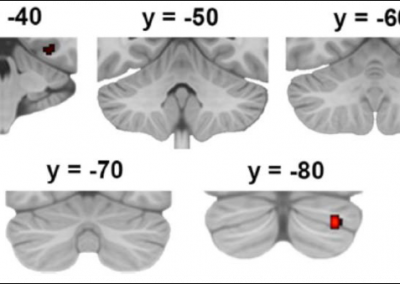
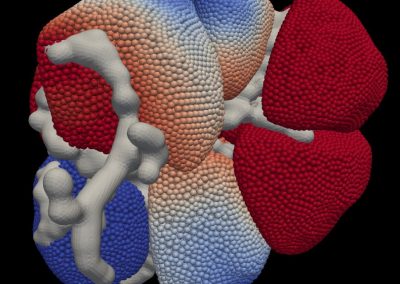
As shown in Figure 2, the diffusion values of each cohort could be statistically summarised to show the variation between ±2 standard deviations for the entire rCST due to the matched dimensionality. Figure 3 shows clustering PCA dimensions PC1 and PC2 (accounting from 33% (FA) to 47% (RD) of the data variation) which allowed for the discrimination between case vs. controls based on the major variance in the DTI measurements from each element of the rCST model
Discussion
A novel approach is introduced for investigating the brain’s white matter tracts by combining different techniques from different disciplines – that is, DTI analysis from MRI; mesh fitting from computer graphics; and PCA from statistical data analysis. By generating the 3D template mesh model of the right corticospinal tract (known to be sensitive to brain injury (1) and morphing it into each subject’s native space, we made a subject-specific model for the tract that matched both the geometry and diffusion metrics distribution.
Conclusion
The work presents a novel method that accounts for the individual subject’s geometric variation, to visualise group differences in quantitative MR data. By embedding tensor-based data from DTI scans to 3D subject-specific mesh, we showed the ability of our model to separate alterations in image-based metrics acquired from contact sports players and non-contact-sports athletes. Future prediction models based on other quantitative MRI methods may benefit from this approach.
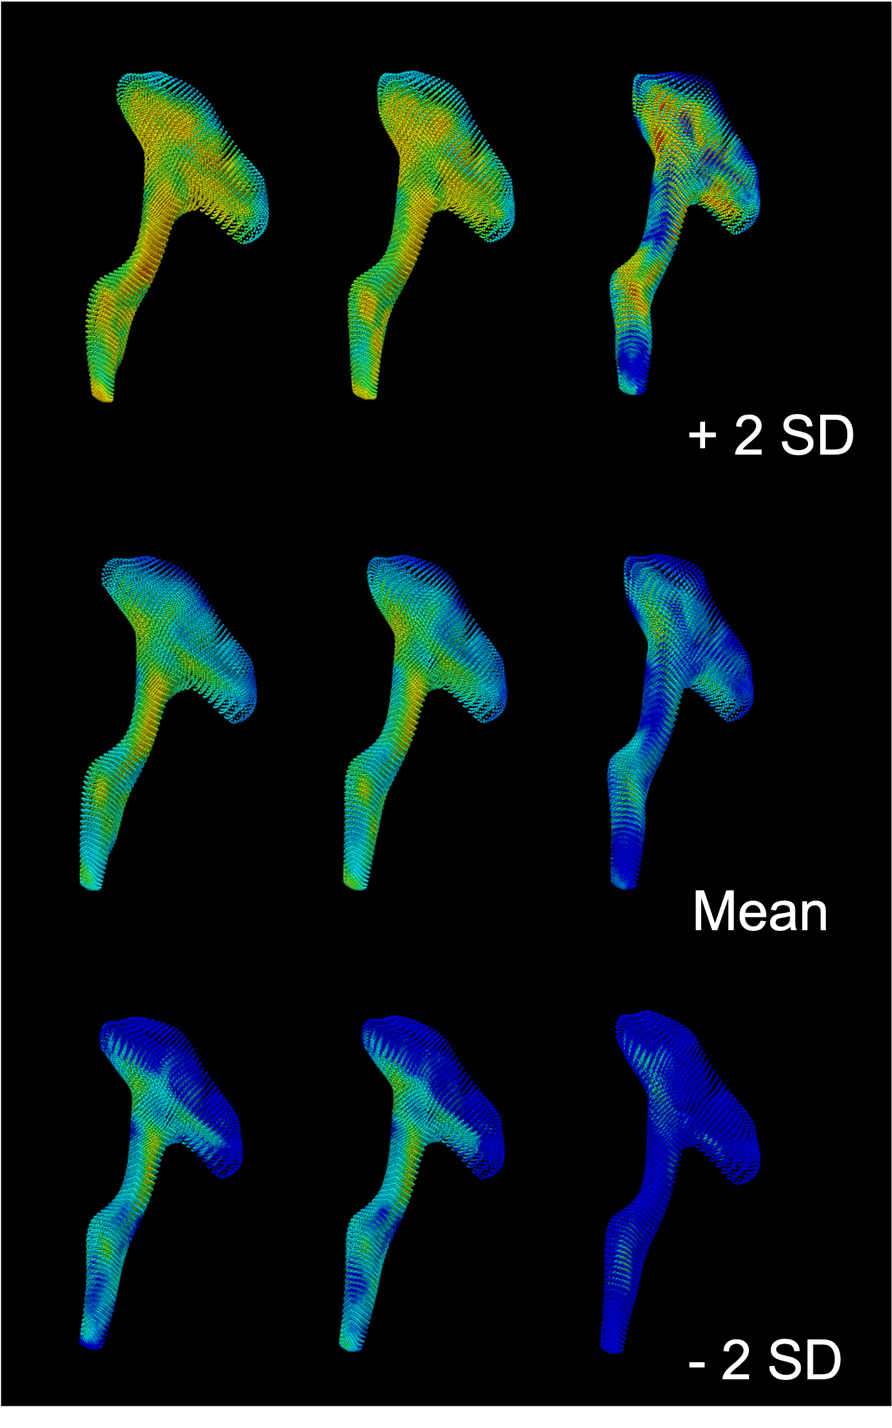
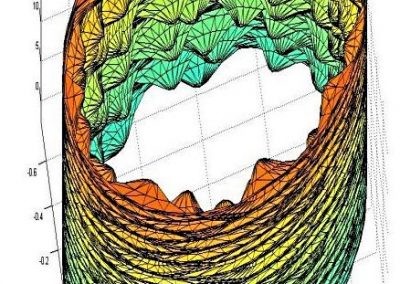
Figure 2: How group average values can be visualized based on the subject-specific mesh fitting result. rCST tract FA value visualisation showing different group mean and ±2 standard deviations of the preseason (left), postseason (middle), and control (right) cohorts
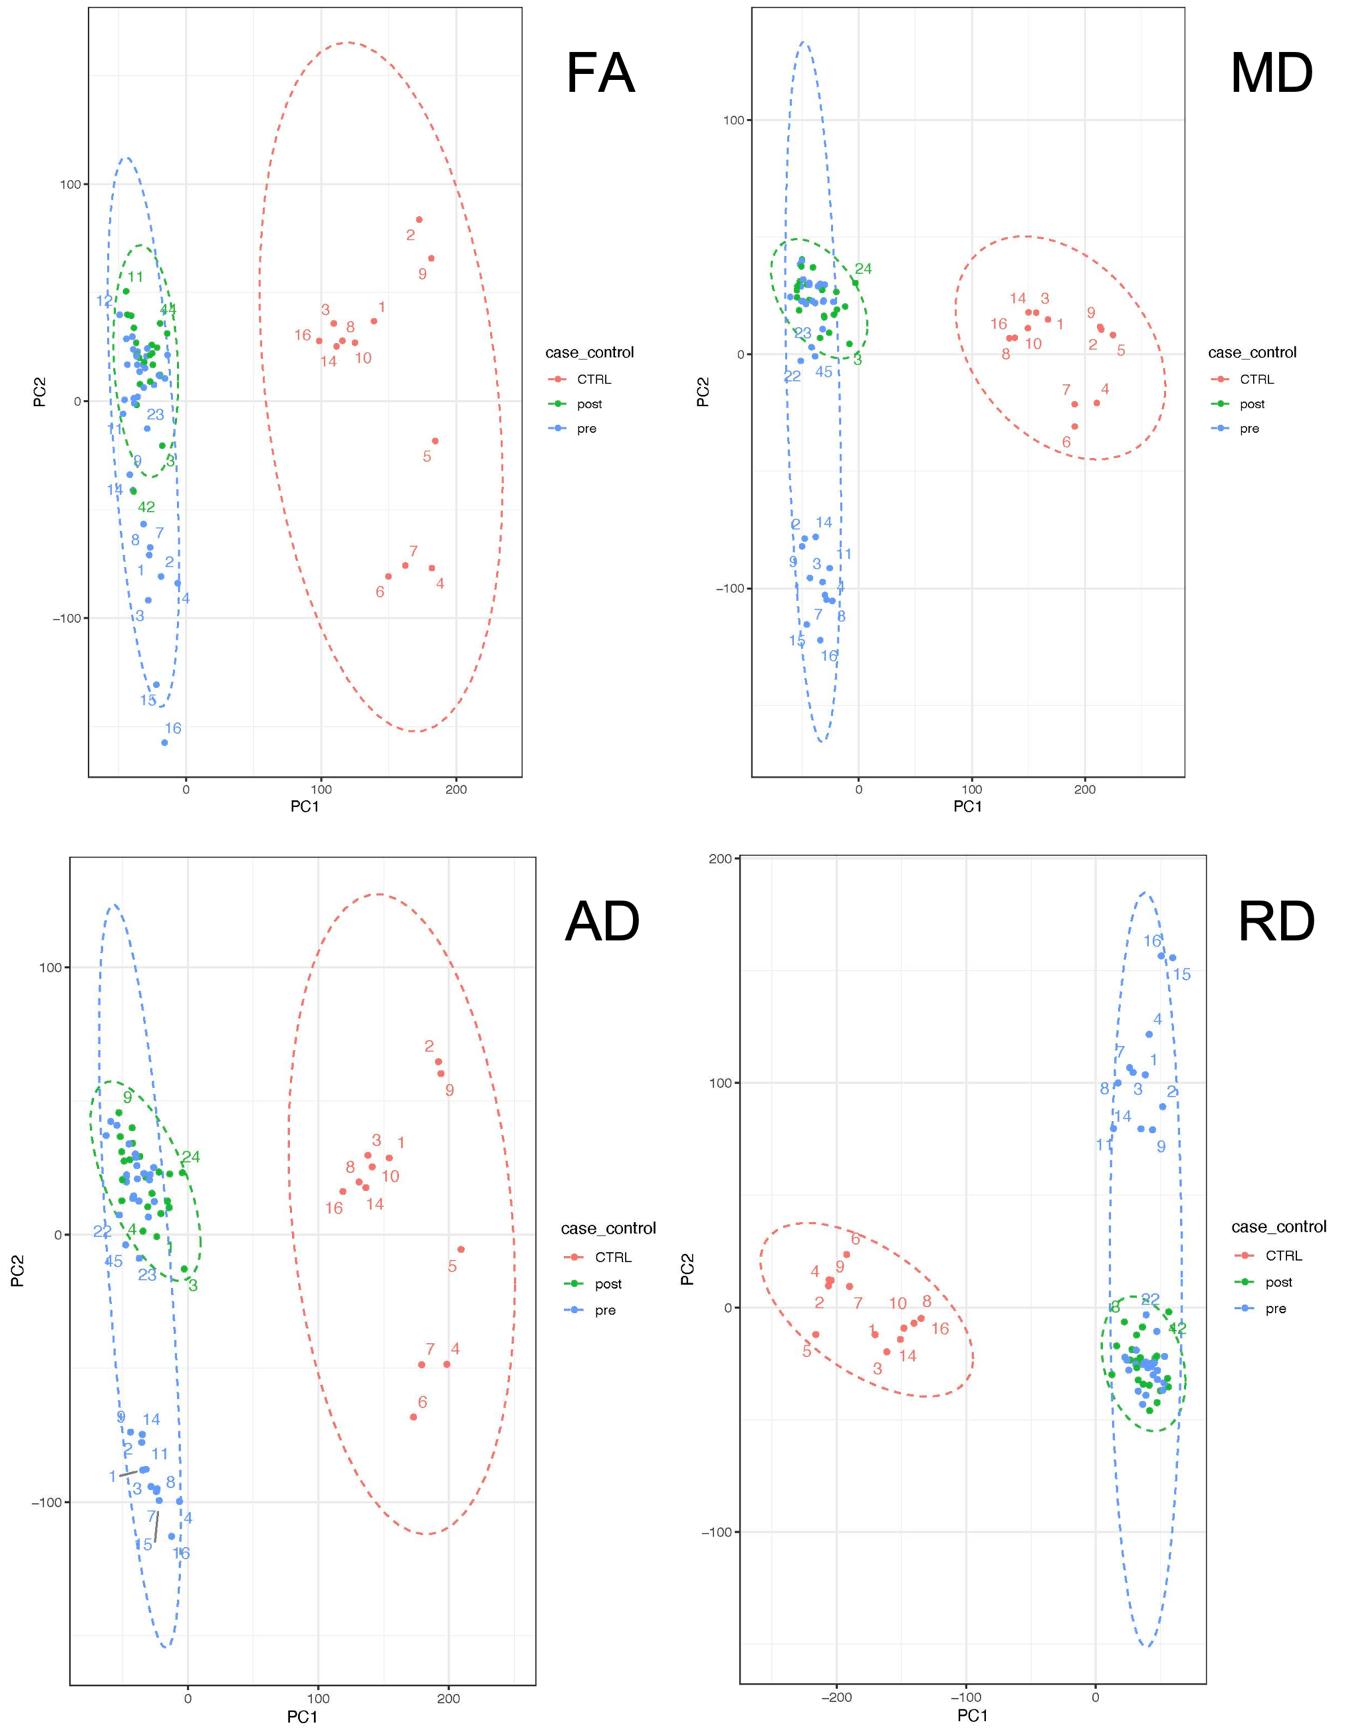
Figure 3: Principal components 1 and 2 shows the clustering of the case and control for each diffusion variable FA (Fractional anisotropy), MD (Mean diffusivity), AD (Axial Diffusivity), RD (Radial Diffusivity).
- Asken BM, DeKosky, S.T., Clugston, J.R. et al. Diffusion tensor imaging (DTI) findings in adult civilian, military, and sport-related mild traumatic brain injury (mTBI): a systematic critical review. Brain Imaging and Behavior 12, 585–612 (2018).
- Woolrich MW, Jbabdi S, Patenaude B, Chappell M, Makni S, Behrens T, et al. Bayesian analysis of neuroimaging data in FSL. NeuroImage. 2009;45(1 Suppl):S173-86.
- Smith SM, Jenkinson M, Woolrich MW, Beckmann CF, Behrens TE, Johansen-Berg H, et al. Advances in functional and structural MR image analysis and implementation as FSL. NeuroImage. 2004;23 Suppl 1:S208-19.
- Jenkinson M, Beckmann CF, Behrens TE, Woolrich MW, Smith SM. FSL. NeuroImage. 2012;62(2):782-90.
- Behrens TE, Woolrich MW, Jenkinson M, Johansen-Berg H, Nunes RG, Clare S, et al. Characterization and propagation of uncertainty in diffusion-weighted MR imaging. Magn Reson Med. 2003;50(5):1077- 88.
- Andersson JL, Skare S, Ashburner J. How to correct susceptibility distortions in spin-echo echoplanar images: application to diffusion tensor imaging. NeuroImage. 2003;20(2):870-88.
- Andersson JLR, Sotiropoulos SN. An integrated approach to correction for off-resonance effects and subject movement in diffusion MR imaging. NeuroImage. 2016;125:1063-78.
- Jenkinson M, Bannister P, Brady M, Smith S. Improved optimization for the robust and accurate linear registration and motion correction of brain images. NeuroImage. 2002;17(2):825-41.
- Jesper L. R. Andersson MJaSS. Non-linear registration aka Spatial normalisation. Oxford, United Kingdom: FMRIB Centre; 2007
- Wakana S, Caprihan A, Panzenboeck MM, Fallon JH, Perry M, Gollub RL, et al. Reproducibility of quantitative tractography methods applied to cerebral white matter. NeuroImage. 2007;36(3):630-44.
- Hua K, Zhang J, Wakana S, Jiang H, Li X, Reich DS, et al. Tract probability maps in stereotaxic spaces: analyses of white matter anatomy and tract-speciYc quantification. NeuroImage. 2008;39(1):336-47.
- Mori S, Oishi K, Faria A V, M ZPC. MRI Atlas of Human White Matter. Amsterdam, The Netherlands: Elsevier; 2005.
- Shim VB, Tayebi M, Kwon E, Guild S, Scadeng M, Dubowitz D, Mcbryde F, Rosset S, Wang A, Fernandez JW, Li S, Holdsworth S. Combining advanced magnetic resonance imaging (MRI) with Ynite element (FE) analysis for characterising subject-specific injury patterns in the brain after traumatic brain injury. Engineering with Computers. 2022.
- Shim VB, Holdsworth S, Champagne AA, Coverdale NS, Cook DJ, Lee TR, et al. Rapid Prediction of Brain Injury Pattern in mTBI by Combining FE Analysis With a Machine-Learning Based Approach. IEEE Access. 2020;8:179457-65.
- Shim VB, Fernandez JW, Gamage PB, Regnery C, Smith DW, Gardiner BS, et al. Subject-specific finite element analysis to characterize the influence of geometry and material properties in Achilles tendon rupture. J Biomech. 2014;47(15):3598- 604.
- Munro JT, Millar JS, Fernandez JW, Walker CG, Howie DW, Shim VB. Risk analysis of patients with an osteolytic acetabular defect after total hip arthroplasty using subject-specific finite-element modelling. Bone Joint J. 2018;100-b(11):1455-62.
- Shim VB, Besier TF, Lloyd DG, Mithraratne K, Fernandez JF. The influence and biomechanical role of cartilage split line pattern on tibiofemoral cartilage stress distribution during the stance phase of gait. Biomech Model Mechanobiol. 2016;15(1):195-204.
See more case study projects

Our Voices: using innovative techniques to collect, analyse and amplify the lived experiences of young people in Aotearoa
Painting the brain: multiplexed tissue labelling of human brain tissue to facilitate discoveries in neuroanatomy
Detecting anomalous matches in professional sports: a novel approach using advanced anomaly detection techniques

Benefits of linking routine medical records to the GUiNZ longitudinal birth cohort: Childhood injury predictors
Using a virtual machine-based machine learning algorithm to obtain comprehensive behavioural information in an in vivo Alzheimer’s disease model
Mapping livability: the “15-minute city” concept for car-dependent districts in Auckland, New Zealand
Travelling Heads – Measuring Reproducibility and Repeatability of Magnetic Resonance Imaging in Dementia
Novel Subject-Specific Method of Visualising Group Differences from Multiple DTI Metrics without Averaging

Re-assess urban spaces under COVID-19 impact: sensing Auckland social ‘hotspots’ with mobile location data
Aotearoa New Zealand’s changing coastline – Resilience to Nature’s Challenges (National Science Challenge)
Proteins under a computational microscope: designing in-silico strategies to understand and develop molecular functionalities in Life Sciences and Engineering
Coastal image classification and nalysis based on convolutional neural betworks and pattern recognition
Determinants of translation efficiency in the evolutionarily-divergent protist Trichomonas vaginalis

Measuring impact of entrepreneurship activities on students’ mindset, capabilities and entrepreneurial intentions

Using Zebra Finch data and deep learning classification to identify individual bird calls from audio recordings
Automated measurement of intracranial cerebrospinal fluid volume and outcome after endovascular thrombectomy for ischemic stroke
Using simple models to explore complex dynamics: A case study of macomona liliana (wedge-shell) and nutrient variations
Fully coupled thermo-hydro-mechanical modelling of permeability enhancement by the finite element method
Modelling dual reflux pressure swing adsorption (DR-PSA) units for gas separation in natural gas processing
Molecular phylogenetics uses genetic data to reconstruct the evolutionary history of individuals, populations or species
Wandering around the molecular landscape: embracing virtual reality as a research showcasing outreach and teaching tool
