Statistical modelling of carryover effects after cessation of treatments
S. Gwynn Sturdevant, PhD candidate, Department of Statistics
Hypertension, high cholesterol, and diabetes are responsible for significant mortality, morbidity, and cost in both developed and developing countries. Rather than intervening after these high-risk conditions develop, it would be preferable to intervene to prevent incidence hypertension, high cholesterol, and diabetes. Our research discussed trial design and analysis for evaluating interventions that prevent them, in particular, the problem of estimating the duration of response to treatment. Put simply, how long does the effect continue after the active intervention ceases?
Randomised controlled trials are generally considered the gold standard when testing for the efficacy of an administered treatment. Recently, a new genre of trial has emerged to test for a carryover effect. For analysis, these trials used naive comparisons of cumulative incidence at the end of the post- treatment follow up period. Diagnosis of hypertension, diabetes, and high cholesterol occurs when a noisy measurement crosses a threshold so incidence is difficult to localise. The purpose of our research is to explore sound methodologies to test a carryover hypothesis in these circumstances.
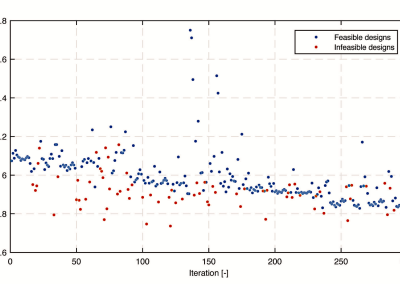
One such trial, Trial of Preventing Hypertension (TROPHY), can be used as a concrete example. In figure 1 we see 3 graphs. The top graph contains the long-term average systolic blood pressure (BP) of two simulated people: one has treatment given the first two years (red), the other is in the control group (blue). Long-term average BP varies throughout the day, over the year, and there is other non-negligible measurement error. The middle graph includes measurement error, the actual data obtained from a study. The bottom graph counts the number of measurements above the threshold; the measurement labelled 3 is when diagnosis occurs and subsequent data would be rendered useless due to trial protocol. Accurate trial design must consider these issues: a noisy measurement crossing a threshold and missing data after diagnosis.
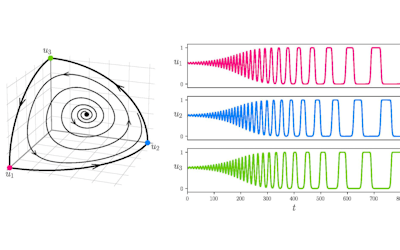
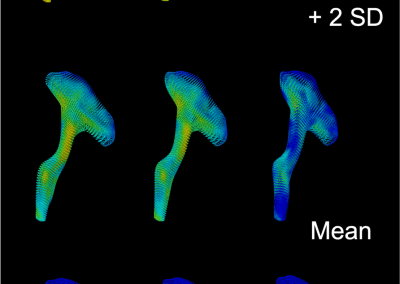
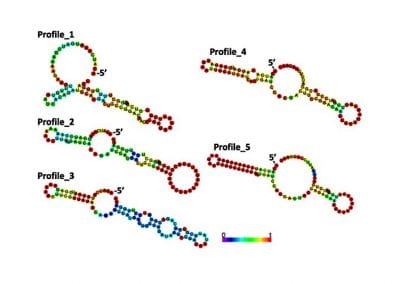
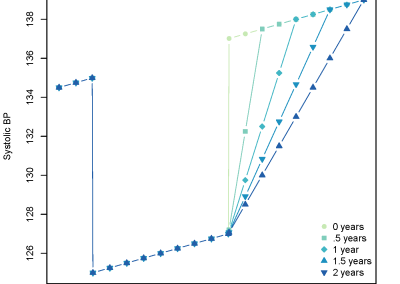
Models with differing lengths of carryover can be seen in figure 2. Mathematically, BP is lowered for the initial 2 years then a carryover is included which varies from 0 to 2 years. At the end of treatment BP returns either quickly to a normal trend, or more gradually, depending upon if carryover does exist and its predefined length.
The error in TROPHY can be explained using figure 1. Due to random variation, the control arm of the trial is more likely to have measurements above the threshold than the treatment group for the initial 2 years. As TRO- PHY diagnosed hypertension when 3 measurements were above the threshold this resulted in a systemic bias in the design. This bias prior to the onset of the carryover period resulted in more diagnoses in the control arm of the study with or without carryover.
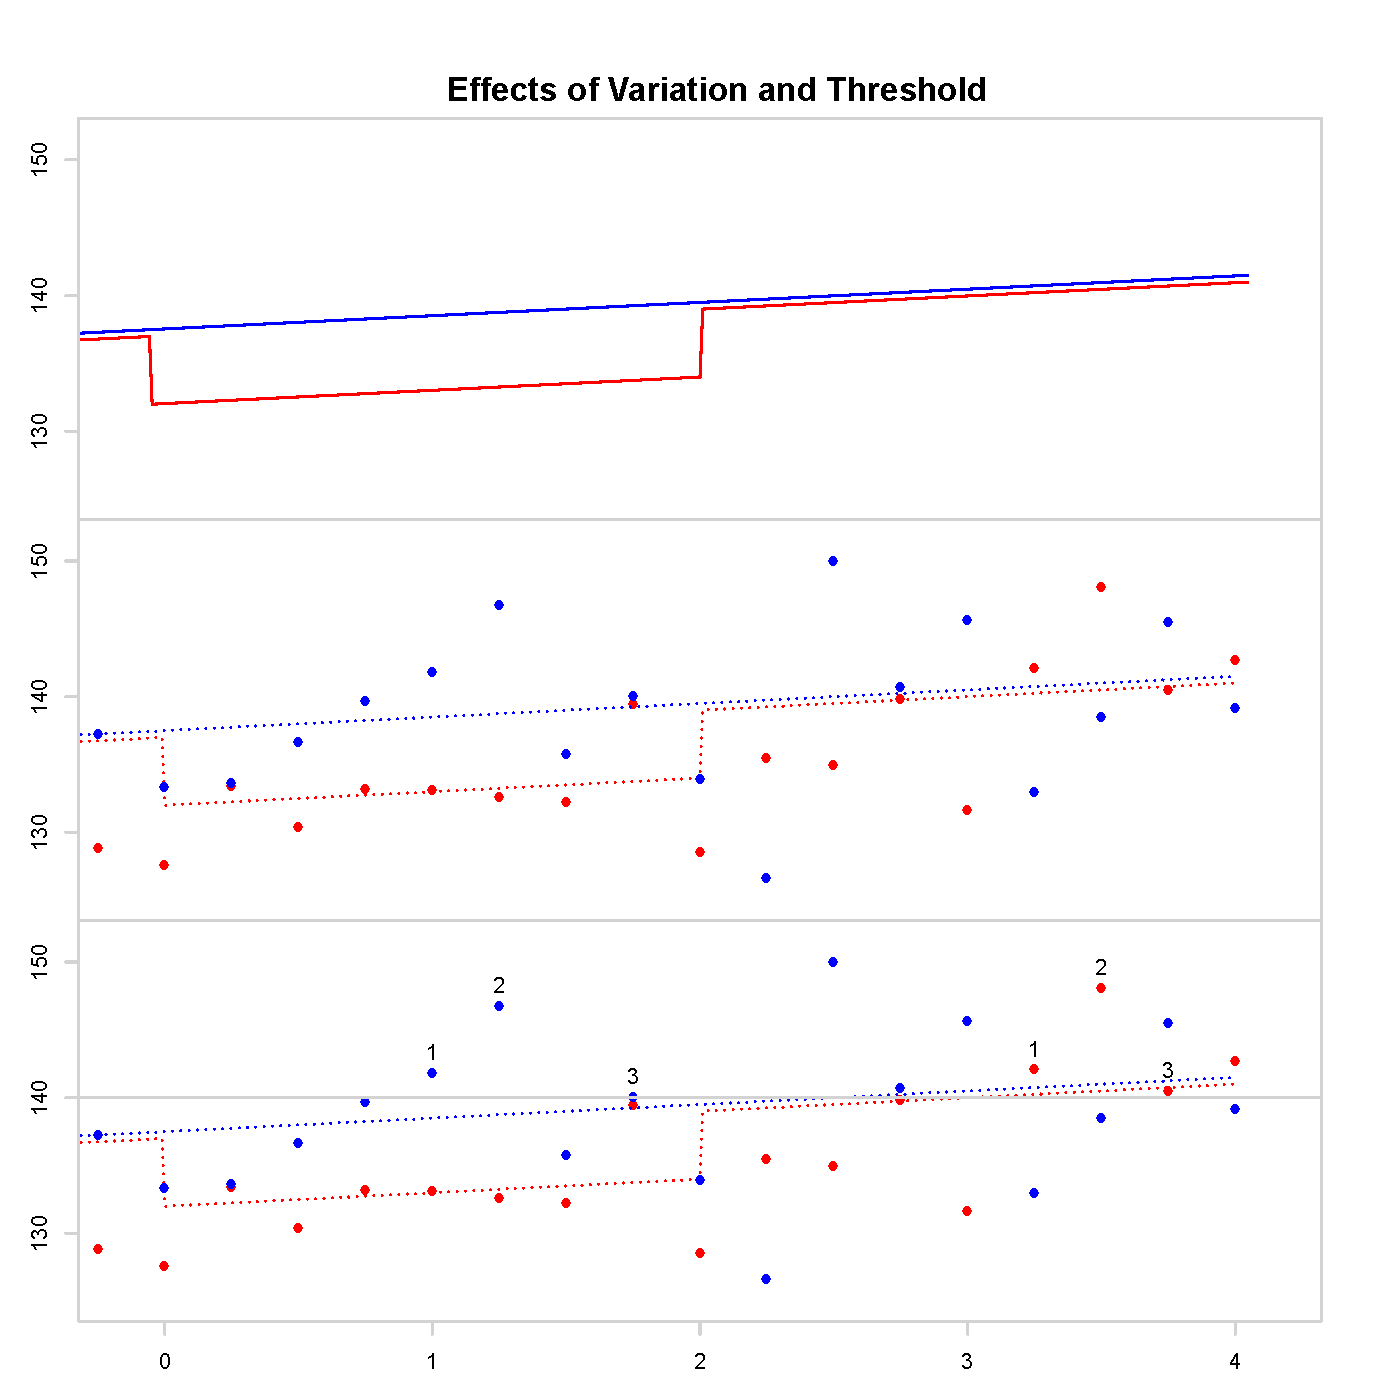
Figure 1: Long-term average BP on the top, measurement error included in the middle, and counting measurements above the threshold on the bottom.
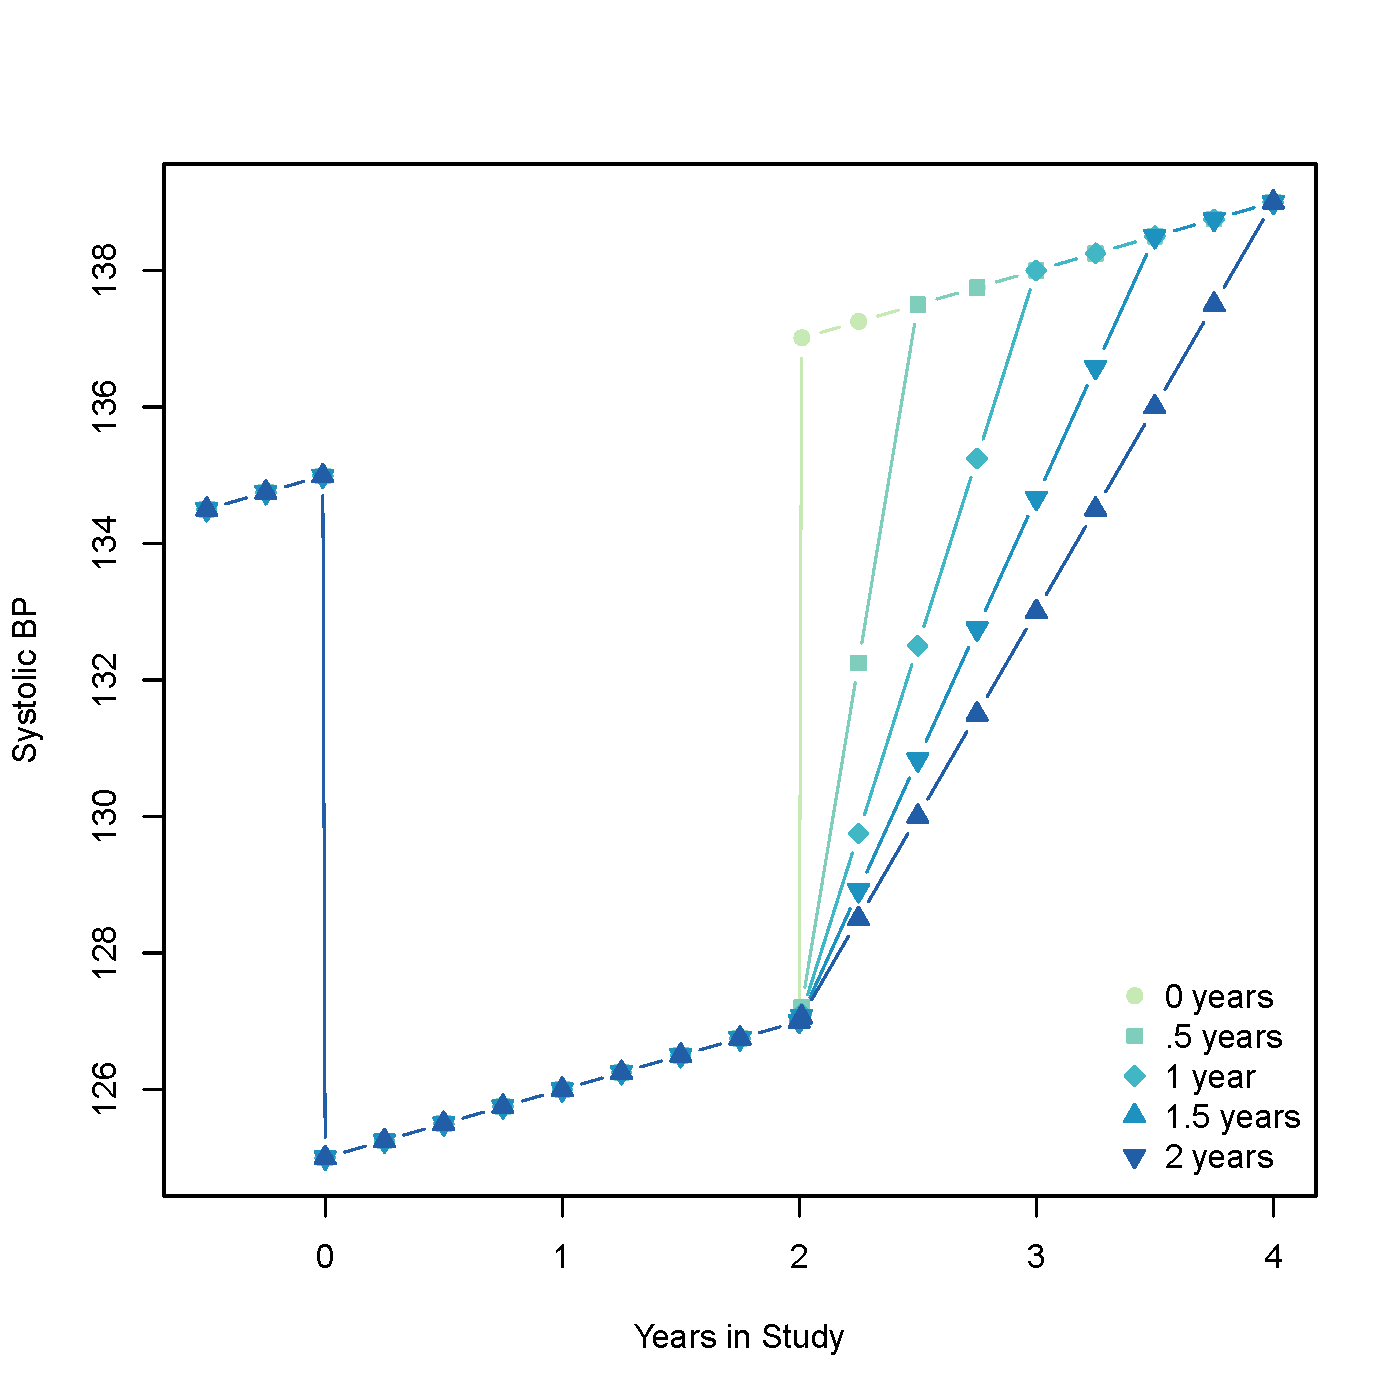
Figure 2: Systolic BP simulation with and without carryover. There are 5 different lengths of carryover: 0, 0.5, 1, 1.5, and 2 years.
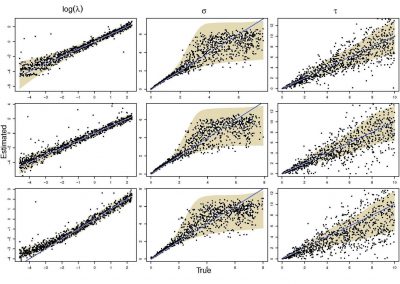
We explored four different approaches: parallel-group trial, crossover trial, linear mixed models, and survival analysis. We conducted systematic simulation studies over varying combinations of parameters to assess both parallel and crossover trials and compared incidence of systolic hypertension to determine power and Type I error rates. The linear mixed model was also assessed via simulation with coverage of relative risks used to measure efficacy. We assessed the survival analysis model by comparing results found from maximising our adjusted likelihood with true hazards found from the data.
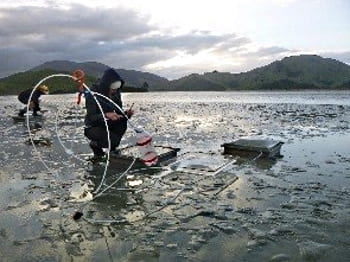
The simulations would not have been possible without the support of the Centre for eResearch, in particular the NeSI Pan cluster. Our research utilised over 1,600,000 CPU hours — on one computer over 182 years — assessing new trial design is computationally intensive. Our design had to be tested on over 7000 differing combinations of parameters and each combination was tested 100 times to determine the biases of the mean estimates.
For the applications of interest researchers will need to apply a linear mixed model and parametric bootstrap to find relative risks. If 1 is in the confidence interval of the bootstrap our simulations suggest that it is 99% likely that the data came from a simulation that contained no carryover in the model.