The Coronary Atlas – data processing workflow optimisation
Ryan Huynh, Sina Masoud-Ansari, Centre for eResearch; Dr Susann Beier, principal investigator of the project, was the research fellow of the University of Auckland; currently a Lecturer at the University of New South Wales.
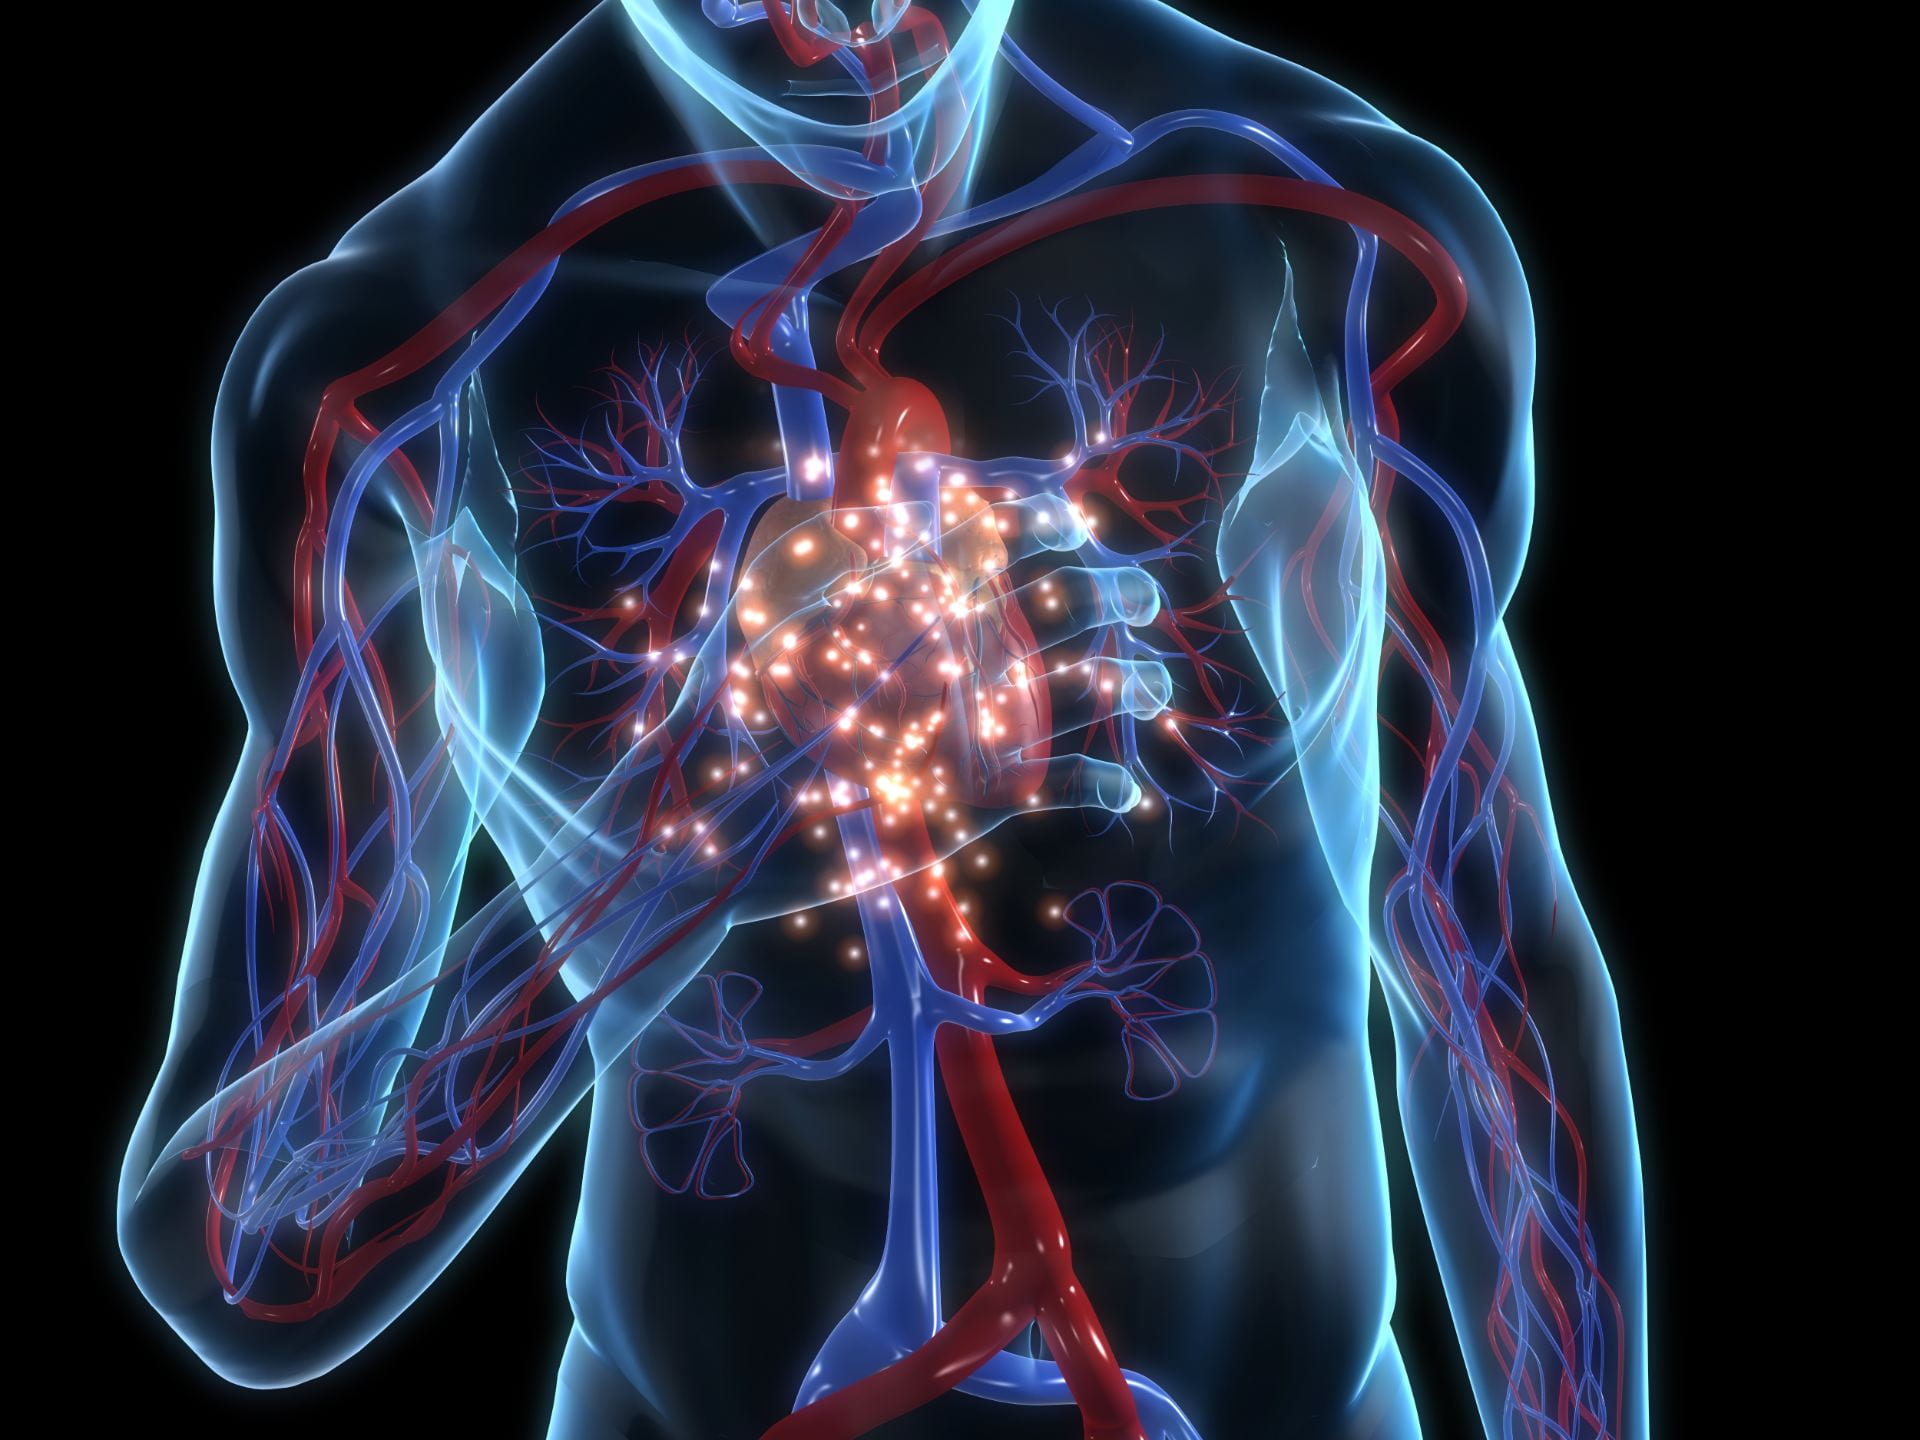
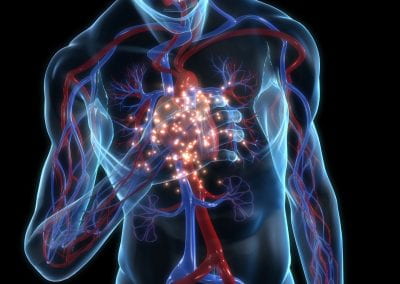
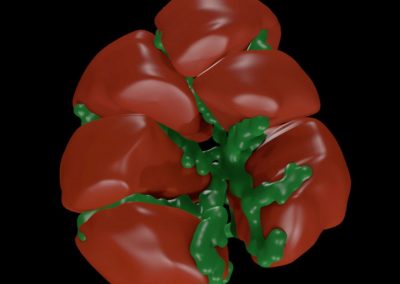
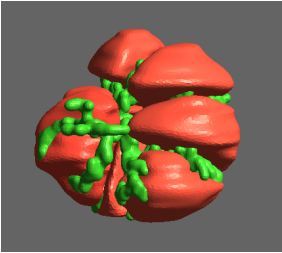
The image is credited to https://www.coronaryatlas.org/
The coronary atlas project aims to understand individual differences in the blood flow environment to generate insights into disease susceptibility for prevention and treatment improvement. The team consists of multiple disciplinary domains including cardiology, medical imaging, fluid dynamics and aerodynamics, computer science, biology, anatomical and statistical model and machine learning experts, Auckland City Hospital and Auckland Heart Group. Note: Dr Susann Beier, principal investigator of the project, was the research fellow of the University of Auckland; currently a Lecturer at the University of New South Wales.
Introduction
“Describing the detailed statistical anatomy of the coronary artery tree is important for determining the aetiology of heart disease. A number of studies have investigated geometrical features and have found that these correlate with clinical outcomes, e.g. bifurcation angle with major adverse cardiac events. These methodologies were mainly two-dimensional, manual and prone to inter-observer variability, and the data commonly relates to cases already with pathology. We propose a hybrid atlasing methodology to build a population of computational models of the coronary arteries to comprehensively and accurately assess anatomy including 3D size, geometry and shape descriptors. A random sample of 120 cardiac 64-CT 3D scans with a calcium score of zero was segmented and analysed using a standardised protocol. The resulting atlas includes, but is not limited to, the distributions of the coronary tree in terms of angles, diameters, centrelines, principal component shape analysis and cross-sectional contours. This novel resource will facilitate the improvement of stent design and provide a reference for hemodynamic simulations, and provides a basis for large normal and pathological database.1
The role of the Centre for eResearch
As part of the research, the Centre for eResearch specialist developed multiple machine learning algorithms and Python scripts to fully automate various workflows in data cleansing, anatomical analyses on 3D models, anomaly detection and segmentation on computed tomographic coronary angiographic (CTCA) images. In addition, we also modelled and streamlined the data management process in order to improve the data quality in the project’s machine learning pipeline.
Coronary artery segmentation using deep learning
Coronary artery lumen segmentation is an important but challenging task given the nature of noise in CTCA images. Deep learning, specifically 3D U-net convolutional neural networks2 (Figure 1) has been very successful in volumetric segmentation for medical imaging.
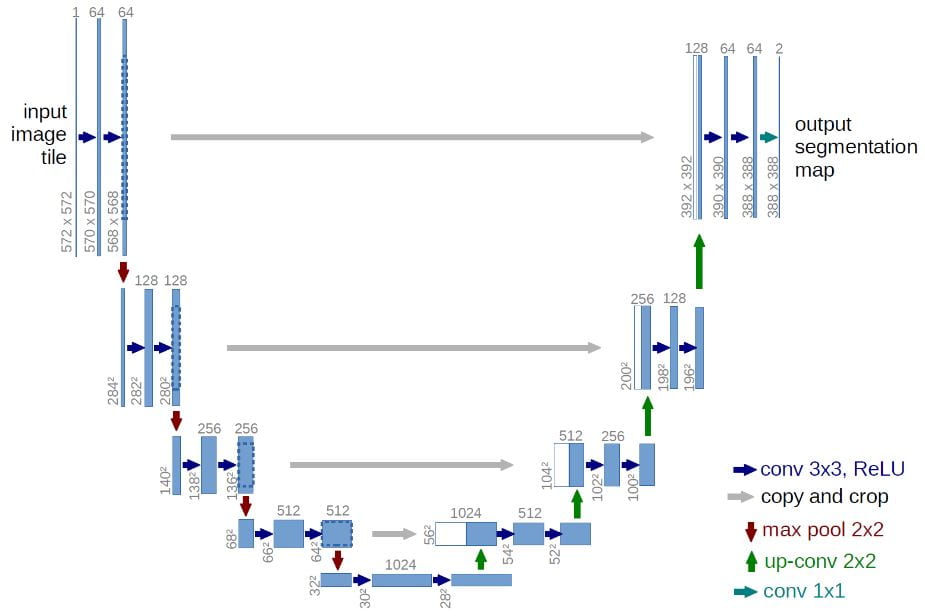
Figure 1.U-net architectur2
Automated anomaly detection for medical images
CTCA scan images often contain texts3 that are not useful for analysis purposes (Figure 2). We implemented an unsupervised density-based spatial of clustering of applications with noise (DBASCAN) algorithm to detect these anomalies. The algorithm takes the mean and standard deviation of pixel values of each slice throughout the volumetric CTCA scans and filters out the anomalies. As a result, we ensured the high quality of input data to our machine learning models. Our framework could also be applied widely in medical imaging and other area.
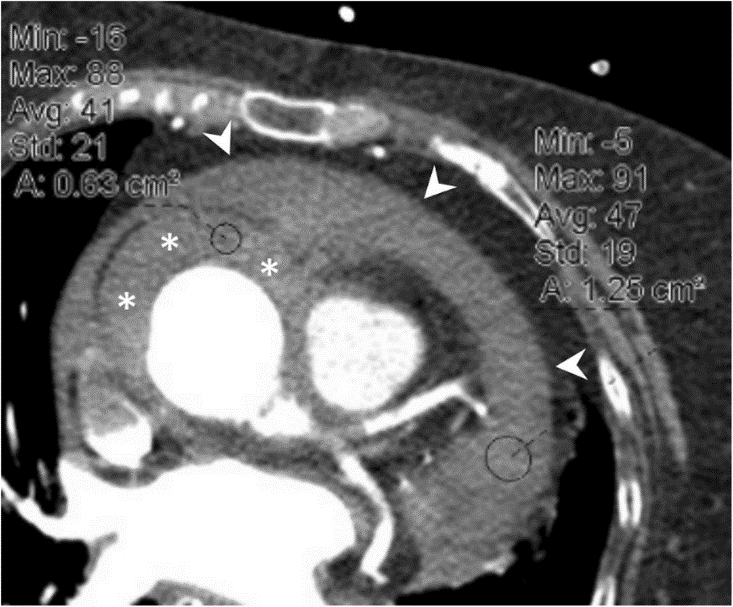
Figure 2. An example of CT image with texts 3
Anatomical assessment of coronary arteries
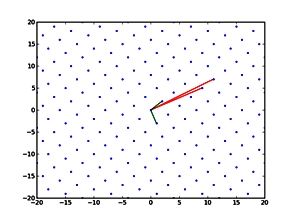
A random sample of more than 1200 cardiac 64-CT 3D scans was segmented and analysed using a standardised protocol. We applied advanced quantitative models to assess the anatomy of a arteries. The resulting atlas includes the distributions of the coronary tree in terms of angles (figure 3)4, diameters and centrelines.
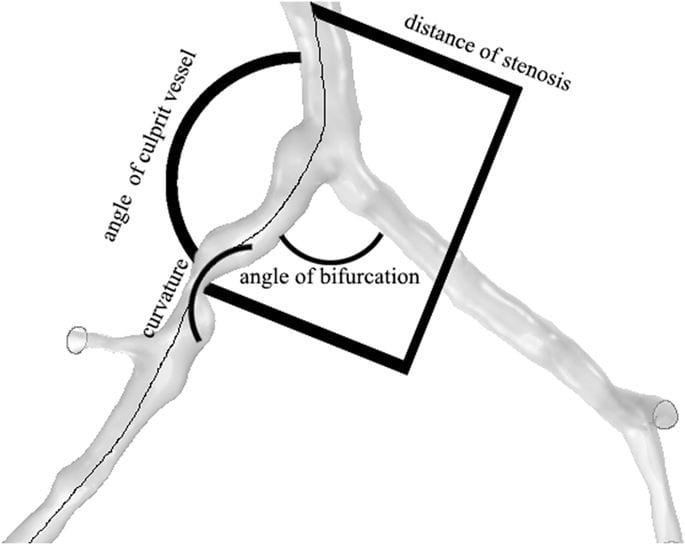
Figure 3. Spatial characteristics of coronary bifurcation4
Streamline data management processes
For a typical biomedical project, the data management processes involve many different stakeholders such as nurses, radiologists, IT technicians and researchers at universities. To streamline these complex processes, we modelled the protocols using data flow charts (DFCs) to document every angle of the data pipeline. After that, we removed any redundancy plus risks to ensure efficiency and quality of the data. We suggested changes and new tools that further streamlined the processes. As a result, we shortened process timeline by over 50%, in addition to an increase in quality of the data.
Reference
- Pau Medrano-Gracia; John Ormiston, Mark Webster, Susann Beier, Chris Ellis, Chunliang Wang, Alistair A. Young, Brett R. Cowan; “ Construction of a Coronary Arterey Atlas from CT Angiography” , International Conference on Medical Image Computing and Computer-Assisted Intervention
- Olaf Ronneberger, Philipp Fischer, Thomas Brox; “U-Net: Convolutional Networks for Biomedical Image Segmentation”
- Emre Ünal, Musturay Karcaaltincaba, Erhan Akpinar, Orhan Macit Ariyurek; “The imaging appearances of various pericardial disorders”
- Yang Yang, Xin Liu, Yufa Xia, Xin Liu, Wanqing Wu, Huahua Xiong, Heye Zhang, Lin Xu, Kelvin K. L. Wong, Hanbin Ouyang, Wenhua Huang; “Impact of spatial characteristics in the left stenotic coronary artery on the hemodynamics and visualization of 3D replica models”
See more case study projects

Our Voices: using innovative techniques to collect, analyse and amplify the lived experiences of young people in Aotearoa
Painting the brain: multiplexed tissue labelling of human brain tissue to facilitate discoveries in neuroanatomy

Detecting anomalous matches in professional sports: a novel approach using advanced anomaly detection techniques

Benefits of linking routine medical records to the GUiNZ longitudinal birth cohort: Childhood injury predictors
Using a virtual machine-based machine learning algorithm to obtain comprehensive behavioural information in an in vivo Alzheimer’s disease model
Mapping livability: the “15-minute city” concept for car-dependent districts in Auckland, New Zealand
Travelling Heads – Measuring Reproducibility and Repeatability of Magnetic Resonance Imaging in Dementia
Novel Subject-Specific Method of Visualising Group Differences from Multiple DTI Metrics without Averaging

Re-assess urban spaces under COVID-19 impact: sensing Auckland social ‘hotspots’ with mobile location data
Aotearoa New Zealand’s changing coastline – Resilience to Nature’s Challenges (National Science Challenge)
Proteins under a computational microscope: designing in-silico strategies to understand and develop molecular functionalities in Life Sciences and Engineering

Coastal image classification and nalysis based on convolutional neural betworks and pattern recognition
Determinants of translation efficiency in the evolutionarily-divergent protist Trichomonas vaginalis
Measuring impact of entrepreneurship activities on students’ mindset, capabilities and entrepreneurial intentions

Using Zebra Finch data and deep learning classification to identify individual bird calls from audio recordings
Automated measurement of intracranial cerebrospinal fluid volume and outcome after endovascular thrombectomy for ischemic stroke
Using simple models to explore complex dynamics: A case study of macomona liliana (wedge-shell) and nutrient variations
Fully coupled thermo-hydro-mechanical modelling of permeability enhancement by the finite element method
Modelling dual reflux pressure swing adsorption (DR-PSA) units for gas separation in natural gas processing
Molecular phylogenetics uses genetic data to reconstruct the evolutionary history of individuals, populations or species

Wandering around the molecular landscape: embracing virtual reality as a research showcasing outreach and teaching tool


