Travelling Heads – Measuring Reproducibility and Repeatability of Magnetic Resonance Imaging in Dementia
Catherine Morgan, Reece Roberts, Lynette Tippett and the Dementia Prevention Research Clinic Staff and Research Group.
School of Psychology and Centre for Brain Research, The University of Auckland.
Cognitive decline in ageing
Some cognitive decline is normal as we age, but people with mild cognitive impairment (MCI) show an age-related decline that is greater than that of their age-matched peers. Dementia is a significant cognitive loss which impacts daily functioning. Approximately 50 million people are living with dementia worldwide, and in New Zealand, 1.4% of the population have Alzheimer’s disease or related dementia. With an ageing population, the prevalence is predicted to double by 2050 [1]. Although MCI can be a precursor, not all people with MCI go on to develop dementia. Biomarkers that accurately track cognitive decline may also hold the potential to predict which individuals will progress to dementia.
The Dementia Prevention Research Clinics (DPRCs)
The reasons why some individuals with MCI progress to dementia and others do not is unresolved and is the focus of the Dementia Prevention Research Clinics (DPRCs) [2], a national New Zealand study with clinics in Auckland, Christchurch and Dunedin. Participants in the DPRC undergo clinical and neuropsychological evaluation and provide blood samples for studies of protein, gene and metabolic biomarkers. Participants also have 18F-florbetaben Positron Emission Tomography (FBB-PET) and Magnetic Resonance Imaging (MRI) scans to evaluate imaging biomarkers. The study is ongoing, and so far data has been collected on over 250 participants, with a large proportion having longitudinal follow up.
Studying dementia with magnetic resonance imaging
MRI biomarkers that are of interest in dementia studies include grey matter brain volumes derived from T1-weighted (T1w) imaging for tissue atrophy (shrinkage), arterial spin labelling (ASL) metrics for cerebral blood flow (hypo-perfusion/hypo-metabolism), diffusion-weighted imaging (DWI) measures for white matter structure, resting state functional MRI (rsfMRI) for functional connectivity and T2w fluid attenuation inversion recovery (FLAIR) derived estimates of white matter hyperintensity (WMH) volume for small vessel disease. Additional, more clinically focused scans in a dementia protocol often include T2-weighted (T2w) and susceptibility-weighted imaging (SWI) to assess vascular health and other pathologies.
Conclusion
We investigated the reproducibility (inter-site) and repeatability (over-time) of 15 quantitative MRI metrics in the context of an ongoing longitudinal study (the DPRCs) of MCI and dementia. Structural metrics exhibited excellent reproducibility across three sites and repeatability over both days and up to five years. Resting state fMRI showed poorer reproducibility and repeatability, while perfusion MRI showed intermediate levels. Variability over time on the same scanner was comparable to variability measured on different scanners, and generally short term repeatably was much better than long term repeatability. This work [3] provides both confidence in the robustness of many MRI-based metrics of dementia and highlights areas for improvement.
The need to standardise MRI in multicentre studies
Multicentre studies, such as the DPRCs allow for larger, and more representative cohorts to be recruited for research trials. However, inter-site measurement variability needs to be quantifiable to interpret the pooled data. For imaging markers to be adopted widely and incorporated into clinical practice, inter-site measurement reliability needs to be established to determine confidence in diagnostic metrics. Reproducibility can be defined as variability due to measurements being collected under different conditions, e.g., at different sites with different hardware or processed with different software.
In addition, knowledge of imaging biomarker variability over time due to measurement uncertainty is essential when monitoring longitudinal cognitive changes as a function of normal ageing, disease, or treatment. Without this crucial information, it cannot be determined whether subsequent changes in the imaging markers are due to underlying physiological changes, or simply measurement variability. Repeatability refers to variability in a measurement collected under the same conditions multiple times.
Method
We assessed reproducibility and repeatability in a suite of imaging parameters used in the DPRC MRI protocol to study cognitive decline. We recruited six “travelling heads” (THs), the same participants who travelled to the three imaging centres in the DPRCs, Auckland, Christchurch, and Dunedin. They were scanned at repeated time-points with the same DPRC MRI scans as used for clinic participants, enabling assessment of the reproducibility and repeatability of quantitative MRI (qMRI) markers for dementia. Images were processed centrally, with the same software used for all data.
Results
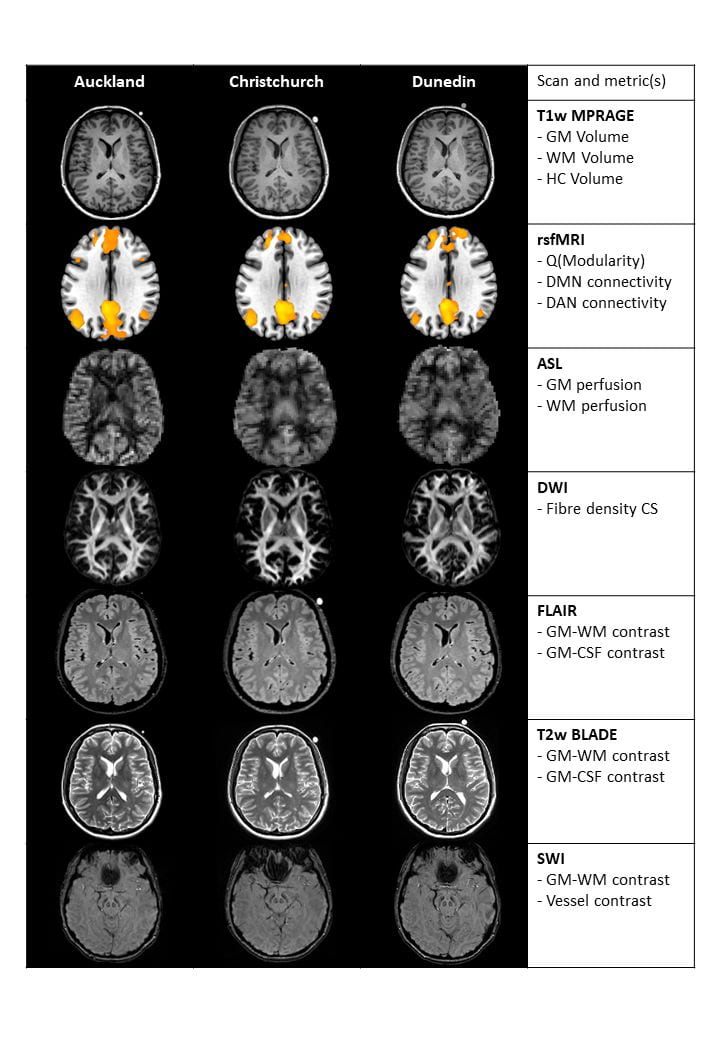
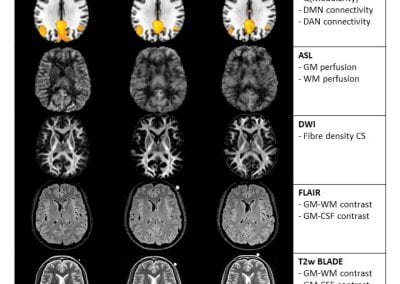
MRI images from a person scanned at the three different sites within seven days are shown in Figure 1, images collected at the different sites show excellent visual agreement with similar signal distribution, contrast, and lack of obvious artefacts. As seen in Figure 2, group means for most metrics appear to be in good agreement between sites, overall group means are reproducible. As one example, group mean hippocampal (HC) volumes were 4.40, 4.38 and 4.44cm3 for Auckland, Christchurch, and Dunedin respectively. Considering individual participant data, inter-site variability would be low compared to inter-subject variation if lines connecting the same participants data at each site do not cross, which appears to be the case for grey matter (GM), white matter (WM), and HC volume. Conversely, the resting state functional MRI (rsfMRI) metrics, (Q, DMN, and DAN connectivity) and ASL metrics (grey and white matter perfusion) have crossing lines, suggesting inter-site variability is greater than inter-subject variability. Repeated scan metrics are plotted relative to baseline values in Figure 3. Volumetric measures derived from T1w images are highly repeatable (top row), as indicated by the flat regression lines and very narrow confidence intervals. Much larger confidence intervals are seen for the functional rsfMRI metrics.
Figure 1. Representative data for a single participant collected at three different sites within seven days (columns 1 to 3) and a list of the 15 derived metrics (column 4). From the top, row 1 shows the acquired T1w MPRAGE scan in participant’s native space, row 2 shows DMN connectivity maps (precuneus seed) processed in from resting state functional MRI data, row 3 shows calculated CBF maps, row 4 shows white matter FOD images, row 5 shows acquired FLAIR images, row 6 shows the acquired T2w images, and row 7 the SWI images. An oil capsule affixed to the left side of the head is seen in some images as an hyperintense circle on the right side of the head (images are presented in radiological orientation). Abbreviations: ASL – arterial spin labelling, CS – cross section, CBF – cerebral blood flow, CSF – cerebrospinal fluid, DAN – dorsal attention network, DMN – default mode network, DWI – diffusion weighted imaging, FLAIR – fluid attenuation inversion recovery, FOD – fibre orientation density, GM – grey matter, HC – hippocampal, MNI – Montreal Neurological Institute, rsfMRI – resting state functional magnetic resonance imaging, SWI – susceptibility weighted imaging, T1w – T1-weighted, T2w – T2-weighted, WM – white matter.

Figure 2. Reproducibility of metrics of interest measured at three different sites. Blue circles represent values measured in individual Travelling Heads at each site and lines connect the same participant. Black thick line is the mean value for all subjects at that site. Abbreviations: Auck – Auckland, CS – cross section, CSF – cerebrospinal fluid, Chch – Christchurch, Dun – Dunedin, DAN – dorsal attention network, DMN – default mode network, FLAIR – fluid attenuation inversion recovery, GM – grey matter, HC – hippocampal, SWI – susceptibility weighted imaging, WM – white matter.
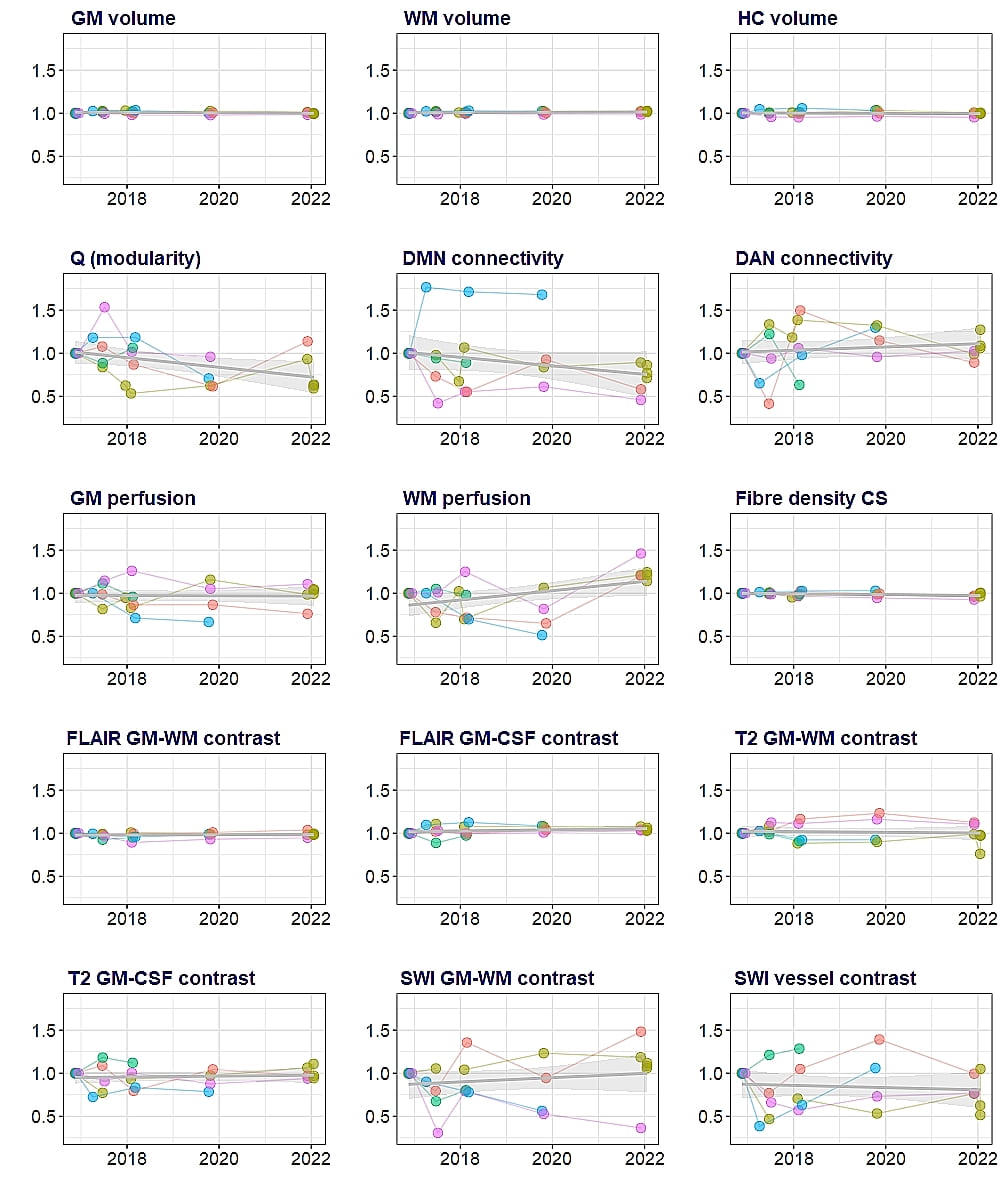
Figure 3. Repeatability of metrics of interest measured at one site (Auckland). Circles represent relative values compared to baseline, measured in individual THs. Colours represent each participant. Grey lines indicate regression lines and shaded areas are 95% confidence intervals. Abbreviations: CS – cross section, CSF – cerebrospinal fluid, DAN – dorsal attention network, DMN – default mode network, FLAIR – fluid attenuation inversion recovery, GM – grey matter, HC – hippocampal SWI – susceptibility weighted imaging, WM – white matter.
Centre for eResearch support
All DPRC MRI data (from the hundreds of study participants and the six travelling heads described in this work) are stored on a Linux virtual machine (VM) hosted by the Centre for eResearch (CeR). Storing and analysing the data on the VM is useful for multiple reasons. 1) Multisite data can be stored in one location and processed centrally. This removes any extra variability in results from data collected between sites and over time (that we are trying to minimise) due to different image processing toolboxes used, 2) The DPRC research team is large and growing, as new members and students join they can easily be added to the VM users list, 3) Some MRI processing software is complicated to install and use. The CeR staff have been critical in helping install imaging software, including Docker packages and Python environments. 4) Some MRI processing software is compute and data intensive. CeR were able to find solutions for us, for example mounting different research drives to the VM and short term use of GPUs for specific data processing tasks. 5) MRI raw data sets and the processed data sets are large. CeR helped us with solutions to archive and backup the data.
References
- Asken BM, DeKosky, S.T., Clugston, J.R. et al. Diffusion tensor imaging (DTI) findings in adult civilian, military, and sport-related mild traumatic brain injury (mTBI): a systematic critical review. Brain Imaging and Behavior 12, 585–612 (2018).
- Woolrich MW, Jbabdi S, Patenaude B, Chappell M, Makni S, Behrens T, et al. Bayesian analysis of neuroimaging data in FSL. NeuroImage. 2009;45(1 Suppl):S173-86.
- Smith SM, Jenkinson M, Woolrich MW, Beckmann CF, Behrens TE, Johansen-Berg H, et al. Advances in functional and structural MR image analysis and implementation as FSL. NeuroImage. 2004;23 Suppl 1:S208-19.
- Jenkinson M, Beckmann CF, Behrens TE, Woolrich MW, Smith SM. FSL. NeuroImage. 2012;62(2):782-90.
- Behrens TE, Woolrich MW, Jenkinson M, Johansen-Berg H, Nunes RG, Clare S, et al. Characterization and propagation of uncertainty in diffusion-weighted MR imaging. Magn Reson Med. 2003;50(5):1077- 88.
- Andersson JL, Skare S, Ashburner J. How to correct susceptibility distortions in spin-echo echoplanar images: application to diffusion tensor imaging. NeuroImage. 2003;20(2):870-88.
- Andersson JLR, Sotiropoulos SN. An integrated approach to correction for off-resonance effects and subject movement in diffusion MR imaging. NeuroImage. 2016;125:1063-78.
- Jenkinson M, Bannister P, Brady M, Smith S. Improved optimization for the robust and accurate linear registration and motion correction of brain images. NeuroImage. 2002;17(2):825-41.
- Jesper L. R. Andersson MJaSS. Non-linear registration aka Spatial normalisation. Oxford, United Kingdom: FMRIB Centre; 2007
- Wakana S, Caprihan A, Panzenboeck MM, Fallon JH, Perry M, Gollub RL, et al. Reproducibility of quantitative tractography methods applied to cerebral white matter. NeuroImage. 2007;36(3):630-44.
- Hua K, Zhang J, Wakana S, Jiang H, Li X, Reich DS, et al. Tract probability maps in stereotaxic spaces: analyses of white matter anatomy and tract-speciYc quantification. NeuroImage. 2008;39(1):336-47.
- Mori S, Oishi K, Faria A V, M ZPC. MRI Atlas of Human White Matter. Amsterdam, The Netherlands: Elsevier; 2005.
- Shim VB, Tayebi M, Kwon E, Guild S, Scadeng M, Dubowitz D, Mcbryde F, Rosset S, Wang A, Fernandez JW, Li S, Holdsworth S. Combining advanced magnetic resonance imaging (MRI) with Ynite element (FE) analysis for characterising subject-specific injury patterns in the brain after traumatic brain injury. Engineering with Computers. 2022.
- Shim VB, Holdsworth S, Champagne AA, Coverdale NS, Cook DJ, Lee TR, et al. Rapid Prediction of Brain Injury Pattern in mTBI by Combining FE Analysis With a Machine-Learning Based Approach. IEEE Access. 2020;8:179457-65.
- Shim VB, Fernandez JW, Gamage PB, Regnery C, Smith DW, Gardiner BS, et al. Subject-specific finite element analysis to characterize the influence of geometry and material properties in Achilles tendon rupture. J Biomech. 2014;47(15):3598- 604.
- Munro JT, Millar JS, Fernandez JW, Walker CG, Howie DW, Shim VB. Risk analysis of patients with an osteolytic acetabular defect after total hip arthroplasty using subject-specific finite-element modelling. Bone Joint J. 2018;100-b(11):1455-62.
- Shim VB, Besier TF, Lloyd DG, Mithraratne K, Fernandez JF. The influence and biomechanical role of cartilage split line pattern on tibiofemoral cartilage stress distribution during the stance phase of gait. Biomech Model Mechanobiol. 2016;15(1):195-204.
See more case study projects

Our Voices: using innovative techniques to collect, analyse and amplify the lived experiences of young people in Aotearoa
Painting the brain: multiplexed tissue labelling of human brain tissue to facilitate discoveries in neuroanatomy
Detecting anomalous matches in professional sports: a novel approach using advanced anomaly detection techniques
Benefits of linking routine medical records to the GUiNZ longitudinal birth cohort: Childhood injury predictors
Using a virtual machine-based machine learning algorithm to obtain comprehensive behavioural information in an in vivo Alzheimer’s disease model
Mapping livability: the “15-minute city” concept for car-dependent districts in Auckland, New Zealand
Travelling Heads – Measuring Reproducibility and Repeatability of Magnetic Resonance Imaging in Dementia
Novel Subject-Specific Method of Visualising Group Differences from Multiple DTI Metrics without Averaging

Re-assess urban spaces under COVID-19 impact: sensing Auckland social ‘hotspots’ with mobile location data
Aotearoa New Zealand’s changing coastline – Resilience to Nature’s Challenges (National Science Challenge)
Proteins under a computational microscope: designing in-silico strategies to understand and develop molecular functionalities in Life Sciences and Engineering
Coastal image classification and nalysis based on convolutional neural betworks and pattern recognition
Determinants of translation efficiency in the evolutionarily-divergent protist Trichomonas vaginalis
Measuring impact of entrepreneurship activities on students’ mindset, capabilities and entrepreneurial intentions

Using Zebra Finch data and deep learning classification to identify individual bird calls from audio recordings
Automated measurement of intracranial cerebrospinal fluid volume and outcome after endovascular thrombectomy for ischemic stroke
Using simple models to explore complex dynamics: A case study of macomona liliana (wedge-shell) and nutrient variations
Fully coupled thermo-hydro-mechanical modelling of permeability enhancement by the finite element method
Modelling dual reflux pressure swing adsorption (DR-PSA) units for gas separation in natural gas processing
Molecular phylogenetics uses genetic data to reconstruct the evolutionary history of individuals, populations or species
Wandering around the molecular landscape: embracing virtual reality as a research showcasing outreach and teaching tool


