Understanding the effects of Airbnb on land use, land value and regulation
Dr Elham Bahmanteymouri, Lecturer, Architecture and Planning, Andrew Leathwick, Nick Young, Centre for eResearch
Background
Towards an analysis of a digital heterotopia, Dr Bahmanteymouri, in her book chapters (Bahmanteymouri, 2022; Bhamanteymouri & Haghighi, 2020), argues that Airbnb is an ephemeral phenomenon that serves as an example of how heterotopian spaces can be rethought in the light of twenty-first-century global capitalism and the sharing economy. With its creative nature, capitalism produces new areas of productivity to overcome its limitation and offers temporary economic solutions. It is shaped by the changing landscape of political, economic, social relations and technology advancement; this innovative space challenges previously established norms. The project focuses on investigating the impact of Airbnb on land use, land value and policy regulations. This new form of entrepreneurship may disrupt the rental and housing market, displacement of neighborhoods, and the government regulatory considerations.
Objectives
Dr Bahmanteymouri approached Centre for eResearch (CeR) to support her with advice on data storage and data visualisation. For her Faulty Research Development Fund (FRDF) project she is researching the ways that a disruptive digital platform technology may influence urban land uses and values and how the government responds to evolving challenges. She had identified the need for visualisation tools to support her to analyse the data she had obtained for 8 cities around the world.
Method of data collection and Methodology of research
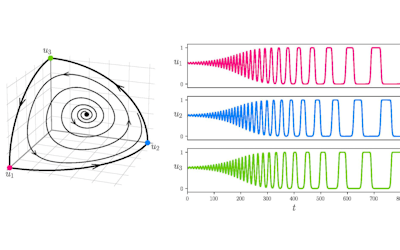
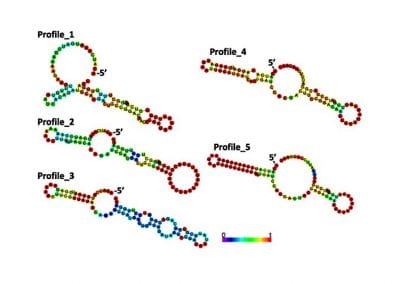
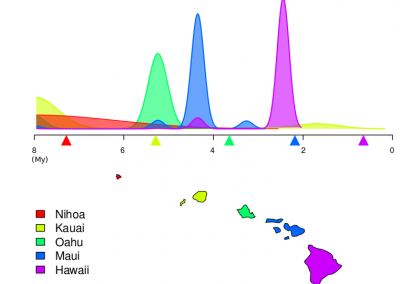
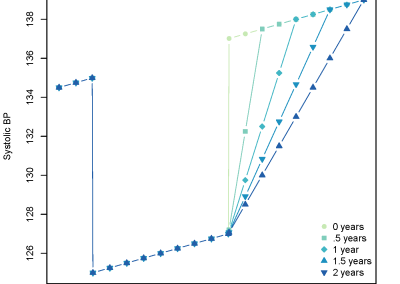
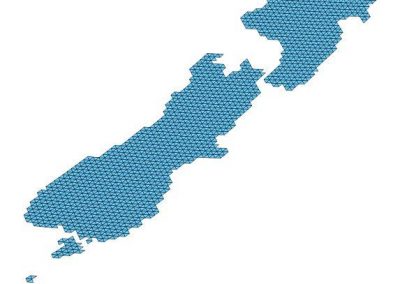
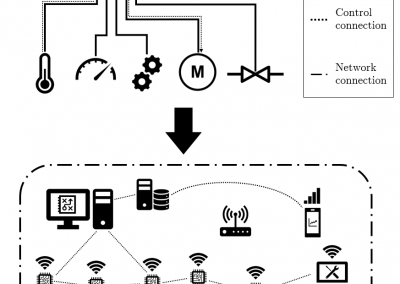
Dr Bahmanteymouri designed the research to test a hypothesis that she has created about the operation of digital platforms in three stages of their lifecycle: emerging, growing, diminishing and negative returns (Figure 1) in a number of New Zealand and overseas cities (Bahmanteymouri, 2022). The hypothesis is examined through the data that she collected from an international data service provider for Airbnb and local councils as well as publicly accessible online sources. The data pertains to four key cities in New Zealand – Queenstown, Christchurch, Wellington and Auckland, together with Sydney, Singapore, and Amersterdam.

Using visualisation to support the exploration of data
Dr Elham asked CeR to help with:
1) putting together two inconsistent layers of data from Airbnb and city councils ; 2) visualising the correlation between variables from demand and supply sides of the market as Elham defined them, and 3) visualising two layers of data from the first stage through ArcGIS maps.The first step of this process was to build data pipelines in a consistent format for each city. The datasets are large and complex with some inconsistencies. Andrew and Nick from the CeR created various visual aids as analytical tools. There were three analytical tools created to communicate where land uses and values have changed in unison with increasing Airbnb density and its revenue as follows:
1. DEMAND AND SUPPLY
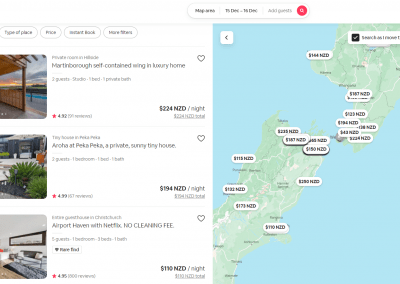
Plotting of Airbnb data to analyse the correlations between supply and demand. These plots are interactive, created in JupyterLab. Below are some examples.

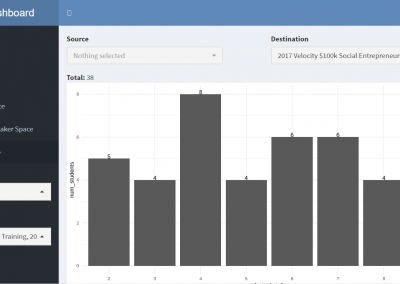
How revenue changes seasonally, and how this relates to the price paid per reserved day, plotted over four years. Variables are normalised by dividing their maximum value, which shows how they fluctuate relative to their maximum value (a checkbox above the plot to turn normalisation on/off). This plot shows little seasonal change in reservation cost compared with the massive seasonal fluctuations in revenue, suggesting the main contributor to changes in seasonal revenue is the number of reservations, rather than the difference in price charged per reservation.

As the number of Airbnbs in operation grows over the four year period plotted, the total number of days on offer per month (‘Non-Blocked Days’) grows, as does the total number of days per month blocked by Airbnb owners from being reserved. Non-Blocked Days is a proxy for supply, and Reservation Days a proxy for demand; interestingly, at the peak of seasonal demand, there is a slight dip in supply (Non-Blocked Days) in February each year, suggesting holiday home owners are themselves utilising properties they would normally have available as Airbnbs. Variables like ‘Reservation Days’ and ‘Blocked Days’ are calculated by summing all the days reserved or blocked across all Airbnbs for a given month. When calculating these variables, the number of days in the month is taken into account so that there is no variation due to longer and shorter months.
Dr Bahmanteymouri was also interested in seeing how variables related to supply and demand differed according to the listing type.
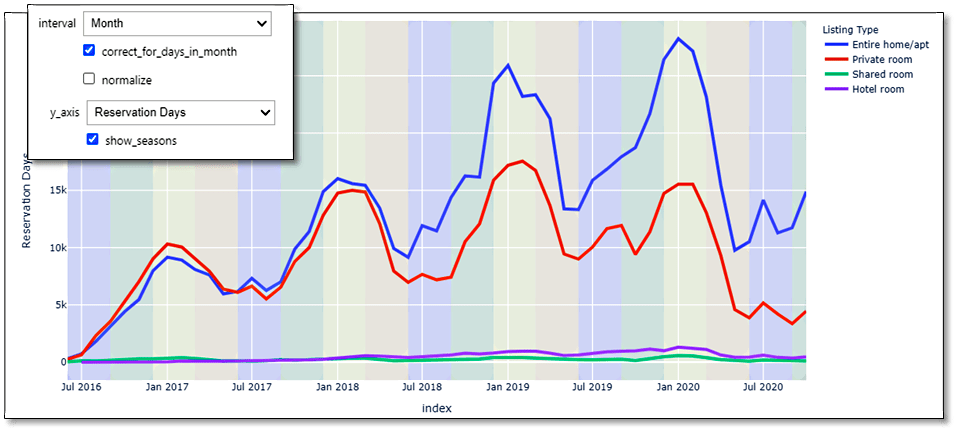
This plot features the same choice of variables as in the previous graph but is plotted one at a time (selected via the dropbox ‘y_axis’), with different lines reserved for different listing types.
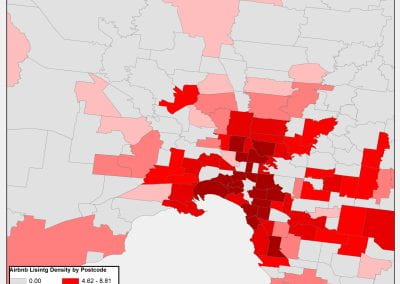
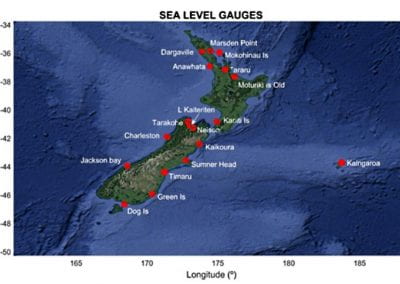
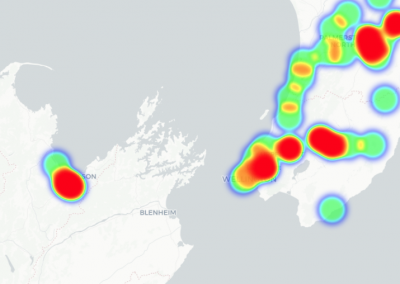
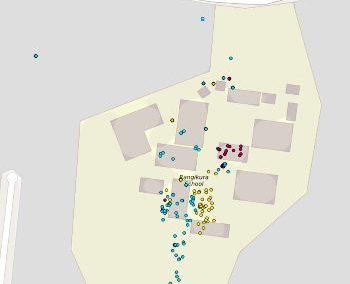
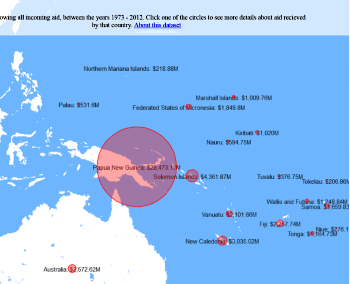
2. GEOSPATIAL DATA
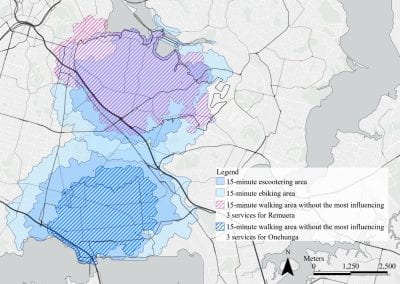
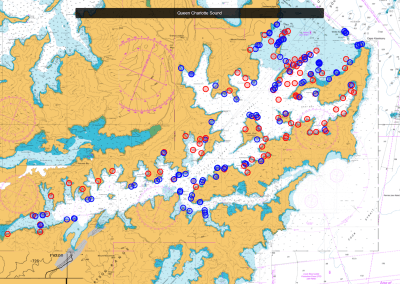
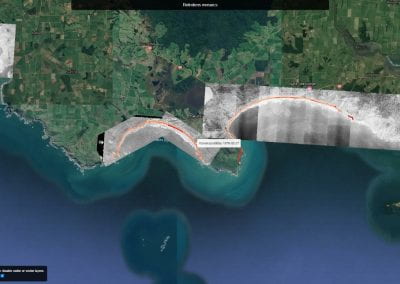
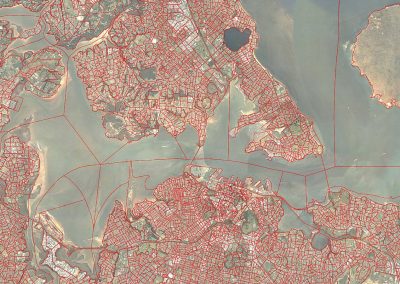
Consistently formatted datasets were created by merging data from various sources, producing land value and land use datasets for each city. Training videos were produced for Dr Bahmanteymouri’s project team to show how this data can be loaded into QGIS and coloured by various variables for analysis. In the example below, parcels are coloured by their land value per m2.

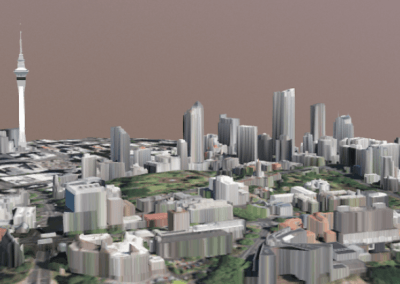
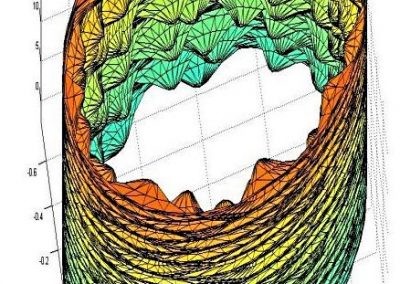
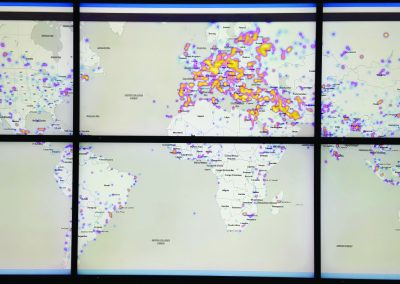
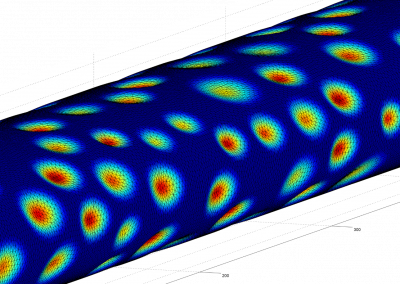
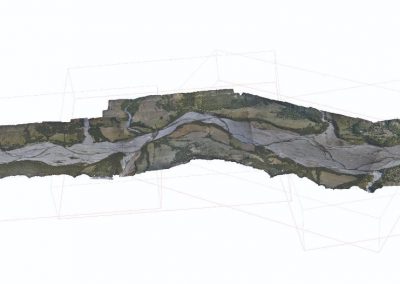
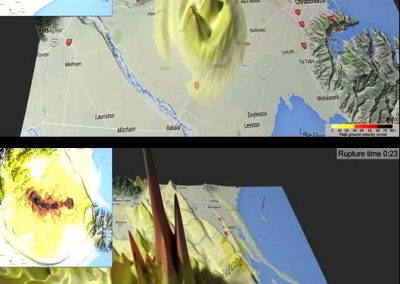
3. 3D MAPS
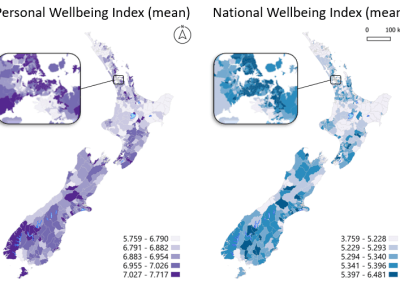
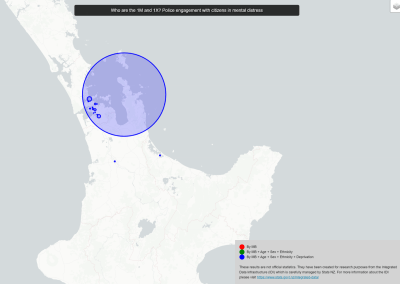
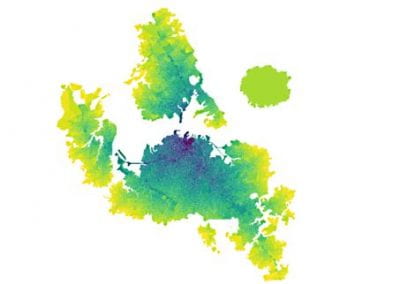
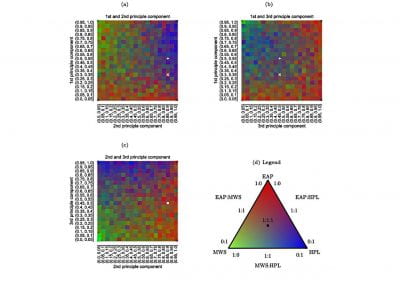
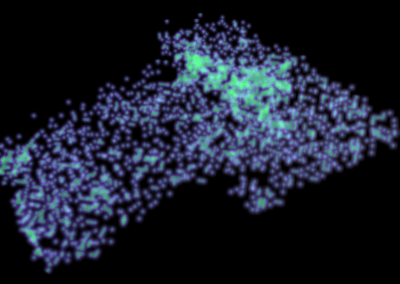
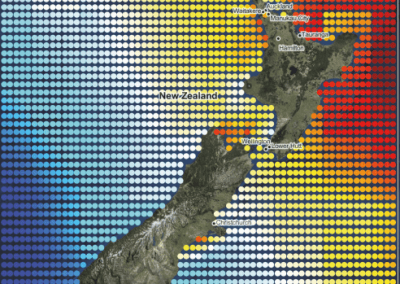
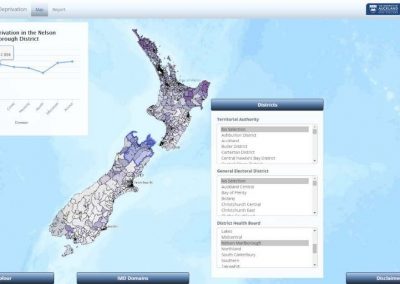
This allows the plotting of bivariate choropleth maps alongside plots showing the distribution of variables for selected areas.

Left: Land value per m2, shown using colour, compared to the number of days reserved for the given period (2019), shown using height. A drop-down menu allows various combinations of variables to be visualised. Right: Plots for the area being hovered over by the mouse.
Next steps
We expect the work to be published and presented to the relevant government agencies and city councils. We also hope the study results provide better insights into the effect of digital platform economy like Airbnb and help decision-makers compare likely impacts and benefits on land values, land uses as well as housing markets in these four cities in New Zealand, so that they can make better decisions and responses on regulatory policy.
References
- Bahmanteymouri, E. (2022). Evaluating the impacts of the digital economy on land use planning. In Y. Yang, & A. Taufen (Eds.), The Routledge Handbook of Sustainable Cities and Landscapes. Routledge.
- Bahmanteymouri, E., & Haghighi, F. (2020). Airbnb as an ephemeral space: Towards an analysis of a digital heterotopia. In S. Ferdinand, I. Souch, & D. Wesselman (Eds.), Heterotopia and globalisation in the twenty-first century. London, UK: Routledge. Retrieved from https://www.taylorfrancis.com/books/9780429290732