Visualising humpback whale migration
Dr Rochelle Constantine, Senior Lecturer, School of Biological Sciences & Institute of Marine Science. 3D visualisation by Nick Young, Research IT Specialist, Centre for eResearch, University of Auckland
Introduction
Understanding the dynamics of population recovery is particularly complex when an organism has multiple, remote breeding and feeding grounds separated by one of the longest known migration routes. As one of the key projects for the Southern Ocean Research Partnership, an International Whaling Commission collective dedicated to non-lethal research methods, and are undertaking a comprehensive assessment of humpback whale (Megaptera novaeangliae) movements from their Oceania breeding grounds and Antarctic feeding grounds in an effort to understand how a rapidly changing Antarctic environment might influence humpback whale population recovery.
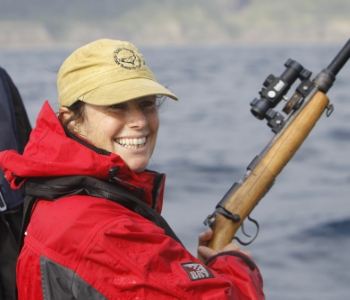
Dr Rochelle Costantine photographed by Claire Garrigue.
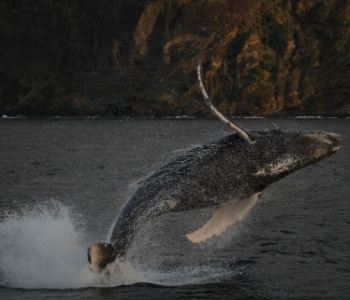
A breaching calf humpback whale photographed by Becky Lindsay
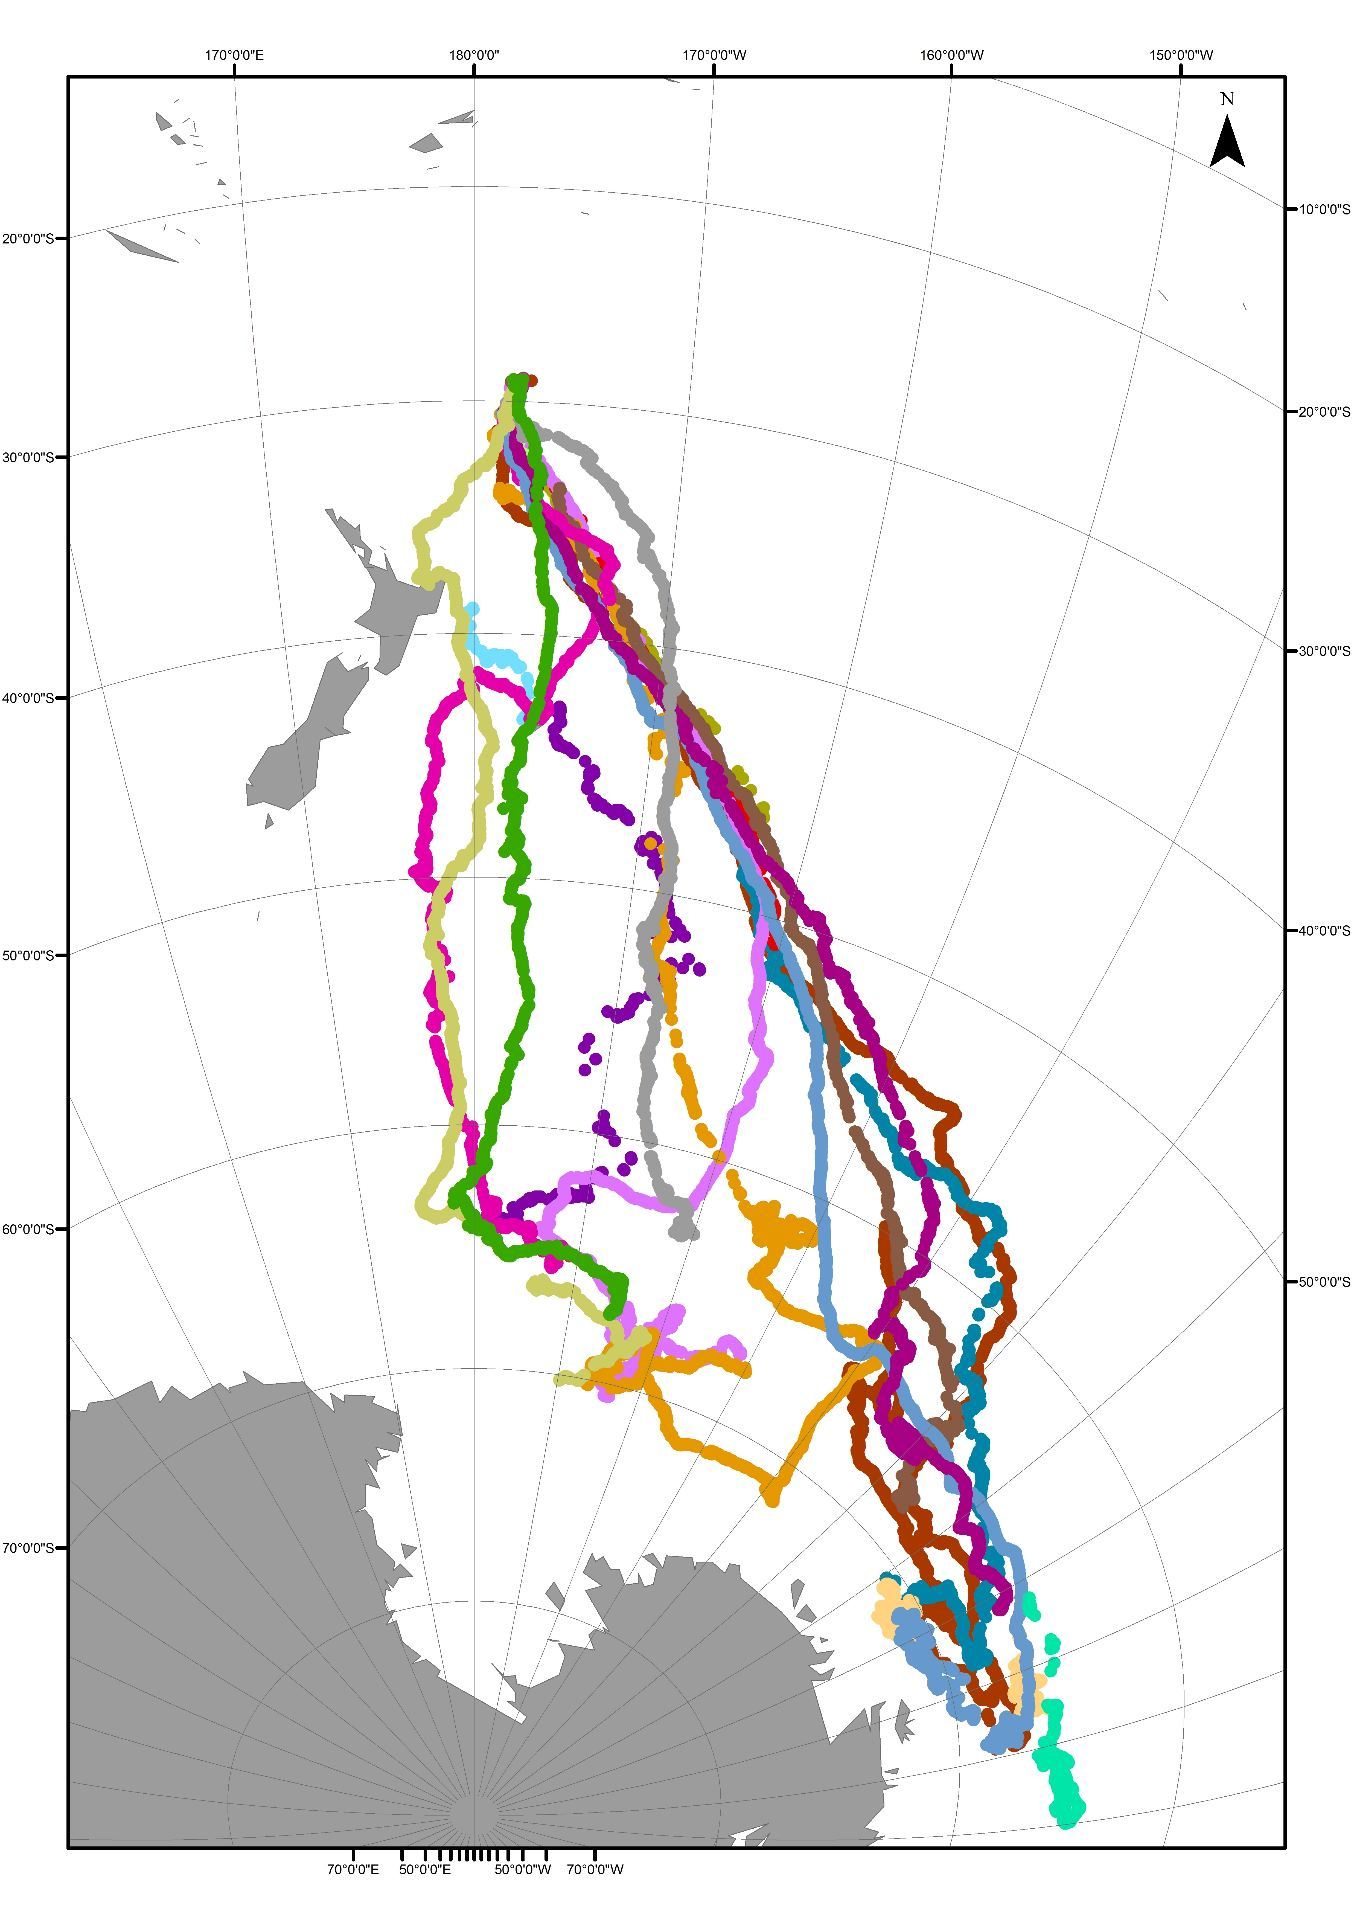
Figure 1. Migration path of humpback whales from Raoul Island, Kermadecs, to their Antarctic feeding grounds.
In 2010, we had a dedicated six-week Antarctic research voyage between 150°W and 150°E and found that the Balleny Islands were critical feeding grounds for east Australian whales. But we still had not found the Oceania whales’ feeding grounds. So in September 2015, we went to the Kermadec Islands and satellite tagged 24 whales, collected tissue samples from 78 individual whales and fluke photo-identification images of 128 individual whales.
This ongoing research has shown (see Figure left) that the whales passing the Kermadecs come from Oceania breeding grounds spanning 3,600 km and feed across 3,500km of Antarctic waters from the western Ross Sea region to the eastern Bellingshausen Sea. Determining the feeding grounds of Oceania’s whales may explain whether prey energetics or migration length are limiting factors to their recovery and will allow an understanding of future ecosystem changes in these whales.
Creating a spatial visualisation of humpback whales
Following Dr Constantine’s study of humpback whale migration, staff at CeR created a spatial visualisation of humpback whales as they migrate from Raoul Island (which is part of the Kermadec group in New Zealand’s northernmost waters half way between New Zealand and Tonga), south to Antarctica. The whales were geotagged/ biopsied by Dr Rochelle Constantine and the research team.
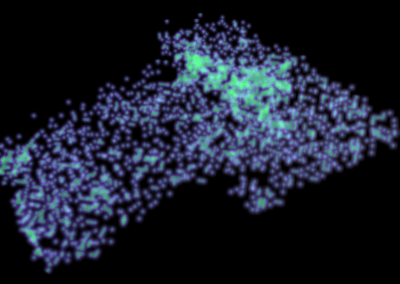
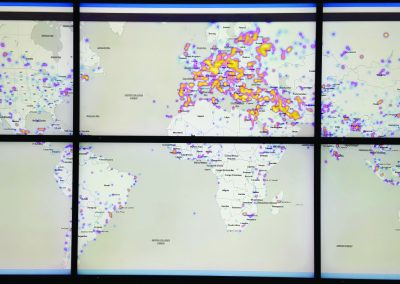
Staff at the Centre for eResearch took the resulting csv data ranges from October 2015 to March 2016, and plotted it on a 3D globe (see Figure 2) using the Cesium javascript library (http://cesiumjs.org/). Additionally, an open dataset provided by NASA describing the monthly average Antarctic ice coverage was integrated.
This “mash-up” of different datasets provides more insight into the specific migrations of the whales – as they are able to move further south as the ice cap recedes in summer. The visualisation effect has been used by Dr Constantine for her education and outreach aid. The code is open source at https://github.com/uoa-eresearch/whale_map and the resulting visualisation can be seen at https://web.ceres.auckland.ac.nz/whale_map_3d/
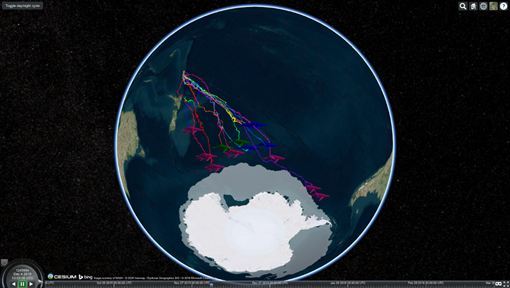
Figure 2. Data plotted on a 3D globe.
See more case study projects

Our Voices: using innovative techniques to collect, analyse and amplify the lived experiences of young people in Aotearoa
Painting the brain: multiplexed tissue labelling of human brain tissue to facilitate discoveries in neuroanatomy

Detecting anomalous matches in professional sports: a novel approach using advanced anomaly detection techniques

Benefits of linking routine medical records to the GUiNZ longitudinal birth cohort: Childhood injury predictors
Using a virtual machine-based machine learning algorithm to obtain comprehensive behavioural information in an in vivo Alzheimer’s disease model
Mapping livability: the “15-minute city” concept for car-dependent districts in Auckland, New Zealand
Travelling Heads – Measuring Reproducibility and Repeatability of Magnetic Resonance Imaging in Dementia
Novel Subject-Specific Method of Visualising Group Differences from Multiple DTI Metrics without Averaging

Re-assess urban spaces under COVID-19 impact: sensing Auckland social ‘hotspots’ with mobile location data
Aotearoa New Zealand’s changing coastline – Resilience to Nature’s Challenges (National Science Challenge)
Proteins under a computational microscope: designing in-silico strategies to understand and develop molecular functionalities in Life Sciences and Engineering
Coastal image classification and nalysis based on convolutional neural betworks and pattern recognition
Determinants of translation efficiency in the evolutionarily-divergent protist Trichomonas vaginalis
Measuring impact of entrepreneurship activities on students’ mindset, capabilities and entrepreneurial intentions

Using Zebra Finch data and deep learning classification to identify individual bird calls from audio recordings
Automated measurement of intracranial cerebrospinal fluid volume and outcome after endovascular thrombectomy for ischemic stroke
Using simple models to explore complex dynamics: A case study of macomona liliana (wedge-shell) and nutrient variations
Fully coupled thermo-hydro-mechanical modelling of permeability enhancement by the finite element method
Modelling dual reflux pressure swing adsorption (DR-PSA) units for gas separation in natural gas processing
Molecular phylogenetics uses genetic data to reconstruct the evolutionary history of individuals, populations or species

Wandering around the molecular landscape: embracing virtual reality as a research showcasing outreach and teaching tool


