Engagement with Citizens in Mental Distress
Assoc Professor Daniel Exeter, School of Population Health, Faculty of Medicine and Health Sciences;
Nick Young, Centre for eResearch
Introduction
While much is known about the prevalence and incidence of mental health based on national survey or routine health databases, little is known about citizens in mental distress that the New Zealand (NZ) Police attend, in response to calls from the general public. The 1M/1X population referred to in this project represent the coding used by NZ Police to categorise citizens being in mental distress (1M) or threats of suicide and/or suicidal behaviours (1X). Unlike centrally funded health services that use the National Health Index (NHI) to follow a patient’s journey through the health system, the NZ Police typically have no prior information about the citizens for whom they are called to provide assistance. We proposed that using Statistics New Zealand’s Integrated Data Infrastructure (IDI) would enable linkage between NZ Police, health and social sector data, to better understand citizens in mental distress. Initially, we proposed to restrict our research to the Auckland region, but the IDI enabled an assessment of events across Aotearoa.
What we did
Using the IDI, we created a whole-of-population cohort based on de-identified, individual-level data from the 2013 Census as our population denominator that was used to ‘follow’ individuals for up to 5 years following the Census. We did not use the 2018 Census data in part due to data quality issues that Census experienced, and also because we would not have had as much follow-up time to explore our research questions. Next, we linked data from the New Zealand Police to the 2013 Census population to investigate the socio-demographic characteristics of citizens in mental distress. Further linkage in the IDI to data from the Ministry of Health enabled us to determine the extent to which citizens in mental distress attended to by NZ Police call outs were current mental health service users, or to determine how soon a citizen would have engaged with the publicly funded mental health system, if the 1M/1X event was their first presentation of mental distress.
Outcomes
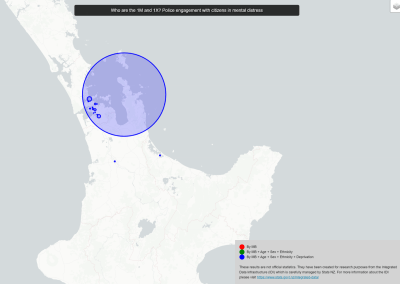
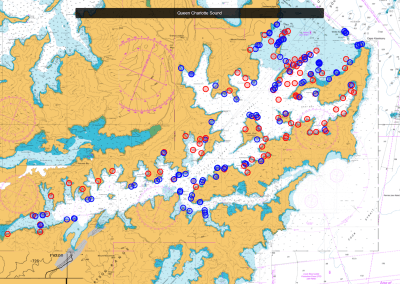
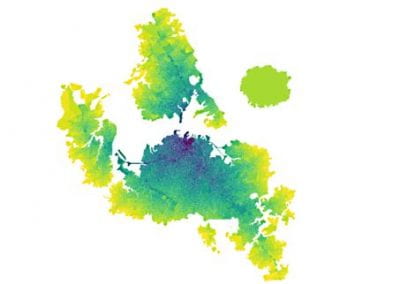
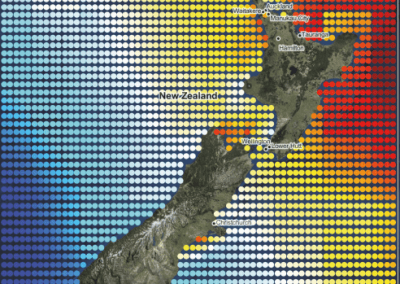
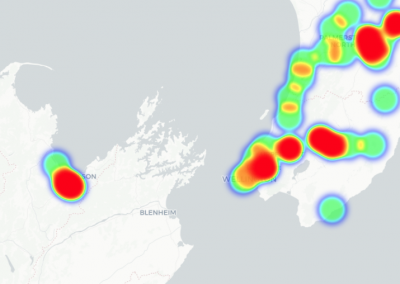
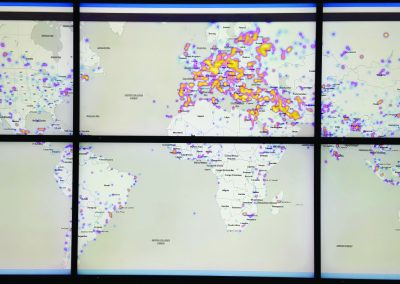
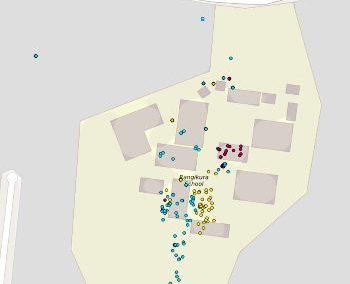
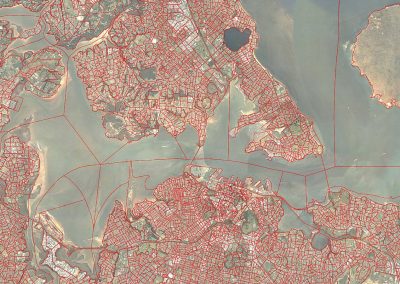
The CeR’s GitHub repository has made the results available for the research team as an interactive map, which is available here. Typically, the output from SaTScan would enable users to show the geographic extent of clusters using administrative boundaries such as Census Meshblocks, SA1s or Data Zones. However, we were restricted in the details we could release from the IDI, due to the risk of potential identification of individuals. To conform with Statistics NZ’s confidentiality constraints, we presented the results as circles. This has meant that some of the clusters appear to overlap which hides the true extent of clustering. The circles in the interactive map represent the geographic extent of 1M/1X clusters, with different colours representing more complex models (red = unadjusted, green = adjusting for age + sex + ethnicity, blue = age + sex + deprivation).
How we did it
Although we had local expertise on hand to apply the conventional epidemiological methods required for this project, the geospatial expertise we needed was more challenging to obtain, in part due to COVID-19 restrictions and staff changes.
We therefore sought out the geospatial expertise of the Centre for eResearch (CeR) team, to explore the spatial and spatio-temporal variations in 1M/1X events. Having previously worked with Nick Young from the CeR team on other geospatial projects, I was confident that the team could adapt to the challenges of the IDI environment while also providing the expertise to perform the analyses required.
To explore the spatio-temporal patterns of the 1M/1X events, Nick used the spatial scan statistic to investigate geographical clusters (hotspots) of 1M or 1X events. Separate analyses were conducted to account for factors that may also explain the presence of any hotspots, such as age, sex, ethnicity and deprivation.
Focussing on Auckland (Figures 1-3), we found ten clusters without controlling for any covariates. These clusters vary by both the geographic extent (size of circles) and the number of 1M/1X events. Adding the green layer reveals that that some of the red clusters have disappeared or reduced in size. This is the effect that adding these socio-demographic factors to the model has in explaining why the clusters exist. The addition of the green layer identified clusters in Hibiscus Coast and Northcote where the number of 1M/1X events is greater than would be expected. It should be noted that explaining why the addition of socio-demographic factors affects a model, it should never be seen as a justification for a variance. When we add controlling for deprivation into the analysis, in addition to the other co-variates, we can see more localised ‘pockets’ of 1M/1X cases in the Auckland Region.

Figure 1 – Unadjusted spatial clusters of 1M/1X responses by NZ Police, in the Auckland Region.

Figure 2 – Clusters of 1M/1X responses by NZ Police, adjusting for age, sex and ethnicity, in the Auckland Region.

Figure 3 – Clusters of 1M/1X responses by NZ Police, adjusting for age, sex, ethnicity, and deprivation, in the Auckland Region.