Visualising the 2010 and 2011 Canterbury earthquakes
Research data simulation produced by Professor Brendon Bradley of QuakeCoRE, University of Canterbury. 3D visualisation by Nick Young, Research IT Specialist, Centre for eResearch, University of Auckland
The background
The 22 February 2011, Mw 6.2 Christchurch earthquake was devastating and is the most costly earthquake to affect New Zealand, causing 181 fatalities and severely damaging thousands of residential and commercial buildings, and most of the city lifelines and infrastructure. It is the largest number of causalities since the 1931 Napier earthquake. Compared to the preceding 4th September 2010 Darfield earthquake, which occurred approximately 30 km to the west of Christchurch, the close proximity of the 22 February event led to ground motions of significantly higher amplitude in the densely populated regions of Christchurch.
The research
Professor Brendon Bradley of QuakeCoRE (based at the University of Canterbury) has used a highly-parallelised software, designed for 3D seismic wave propagation simulations on NeSI’s BlueGene/P supercomputer, to develop a sophisticated understanding of the effects of earthquake-induced ground shaking. This software, developed by US collaborator Rob Graves (US Geological Survey), enabled the team to simulate all the events in the Canterbury earthquake sequence accounting for the complex nature of earthquake rupture and wave propagation in the Canterbury sedimentary basin.
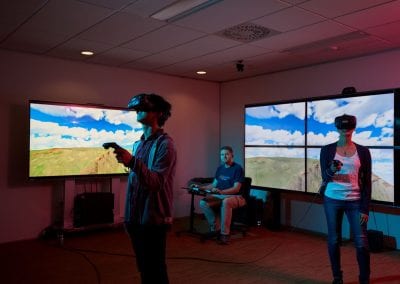
Professor Bradley presented an overview of observed geotechnical aspects of this earthquake as well as some of the completed and on-going research investigations. These Visualisations work have significantly helped Professor Bradley to convey his research findings to both technical and non-technical audiences via conferences or social media, and provide quick and valuable insights to comprehend the magnitude of the event to general public.

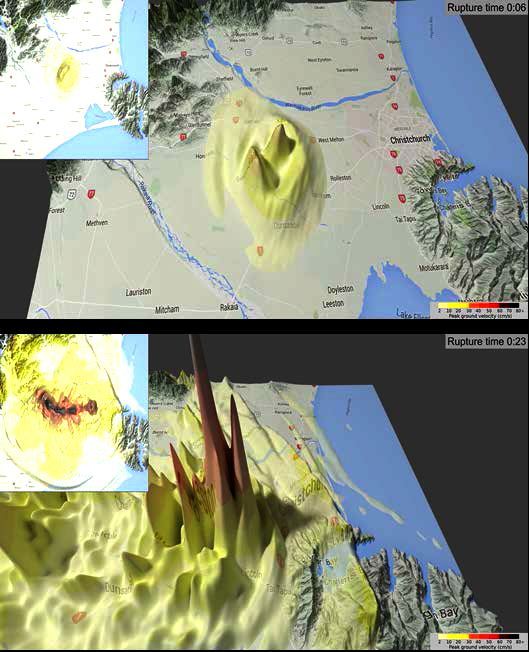
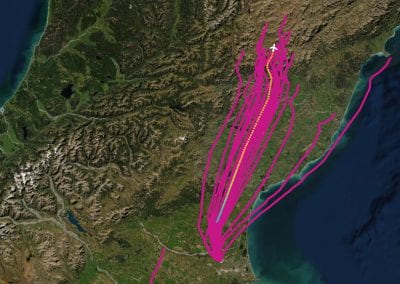
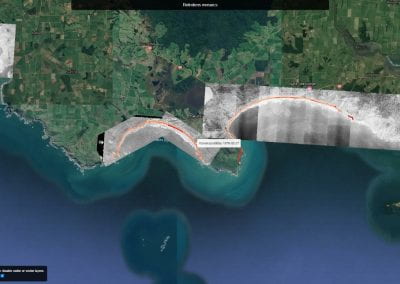
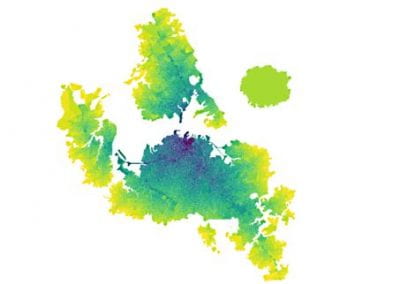
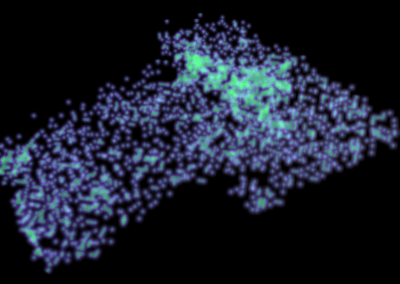
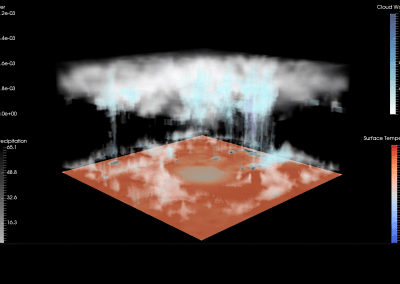
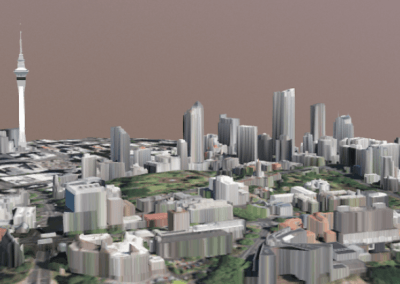
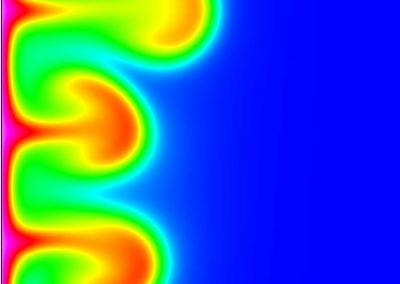
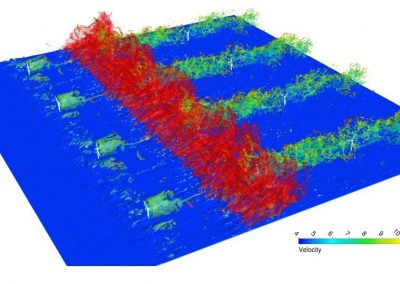
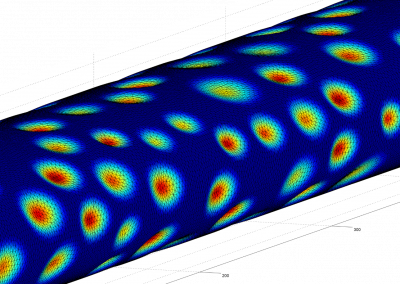
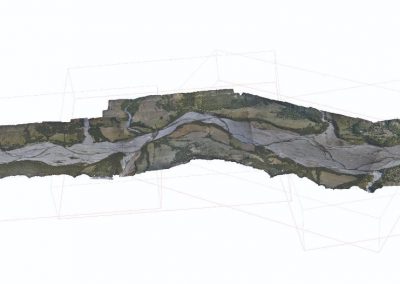
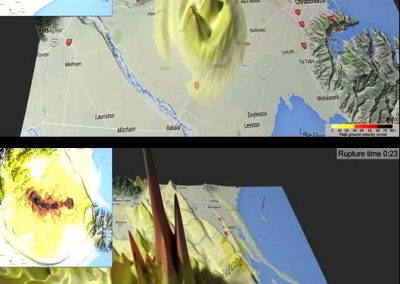
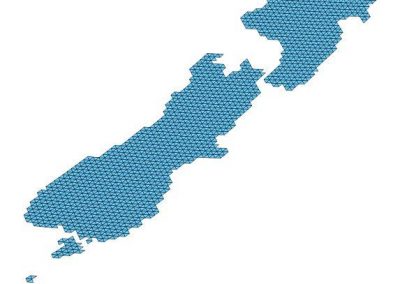
Figure 1a. top and 1b. bottom. Screen shots of the Blender animation from a simulation of a potential Alpine Fault earthquake.
Visualisation of a potential Alpine Fault
Following Professor Bradley’s ground motion modelling study, staff at the Centre for eResearch (CeR) were consulted to create visualisations of the earthquakes occurring at Darfield in 2010, in Christchurch in 2011, and a potential Alpine Fault scenario was also created. These visualisations were based on simulation outputs produced by Professor Bradley. Staff at CeR developed a Python script to read in the binary simulation outputs, and generate an animated model in Blender (an open source 3D modelling tool). This code is open source at https://github.com/uoa-eresearch/earthquake-viz. Additional post processing was done to add colouring based on displacement, a camera path, a legend and a timer.
The Alpine Fault scenario was significantly more complicated in terms of spatial and temporal resolution than the other two Canterbury earthquakes. As a result, even the visualisation required High Performance Computing (HPC) resources, with partial rendering performed on the NeSI Pan cluster in order to speed up the rendering. Rendering is what we call an embarrassingly parallel problem (each frame can be rendered separately from the others) – which makes it suitable for HPC. These visualisations (see Figures 1.a & 1.b below) have significantly helped Professor Bradley to convey his research findings to both technical and non-technical audiences via conferences or social media and provide quick and valuable insights to comprehend the magnitude of the event to general public. The final result can be seen at YouTube. https://www.youtube.com/watch?v=uGWbjYy3to0